English version:
Samples/data acquired during seasonal (JERICOBENT-1 to -4 -6), mapping (JERICOBENT-5, LEG-1 and LEG-2; JERICOBENT-8) and Kullenberg (JERICOBENT-7) campaigns have been analyzed and publications are in progress. Results are described with 9 figures:
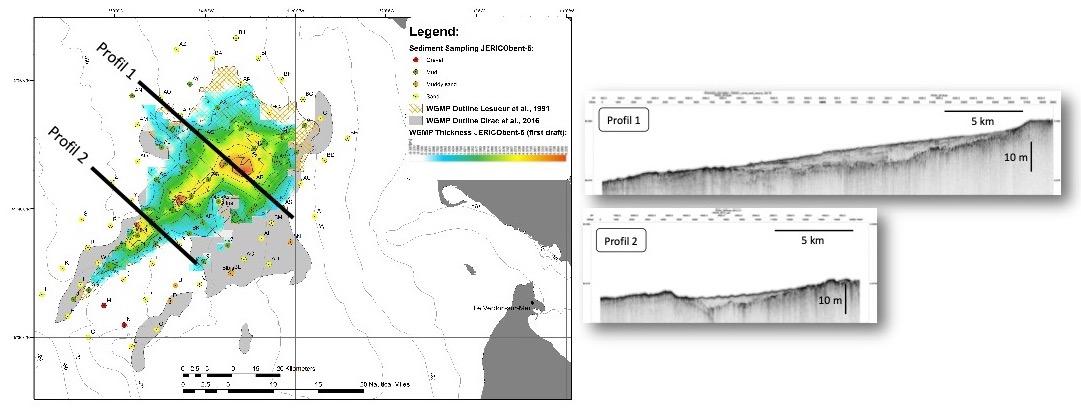
Figure 1 : The surface measurements in June 2018 of the West Gironde Mud Patch (WGMP) indicates that it forms a lenticular sedimentary body which is oriented NE-SW and located between 30 and 75 m depth. Both examples of seismic profiles show that the mud patch fills a slight depression of substratum, confirming the existence of a paleovalley (Lesueur et al 2002). Our initial observations also indicate that the sediment layer can grow locally up to 6 m thick, which is significantly higher than previous assessments, i.e. 4 m (Jouanneau et al. 1989, Lesueur et al. 1991, 2002). It is noted that the present delimitation of the WGMP area is smaller than the one recently proposed by Cirac et al (2016), which was based on a set of sedimentary data covering over about 30 years, thus representing the maximum expansion of the WGMP over this period, and not its current delimitation. On the other hand, there is a good coherence between the actual area and the one proposed by Lesueur et al (1991) with a noticeable reduction in its proximal part at the bathymetry 30 m.
____________________
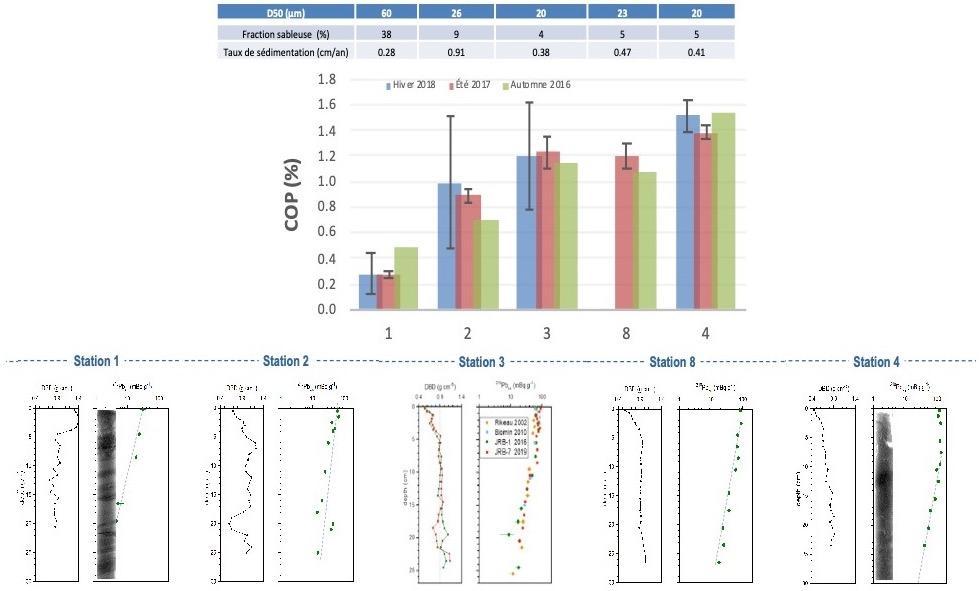
Figure 2 : The particulate organic carbon (POC) content of WGMP sediments increases along an inshore-offshore gradient from 0.28±0.16% at Station 1 to 1.52±0.12% at Station 4. This spatial pattern is generally found in all three seasons (summer 2017, winters and spring 2018). The low level of POC observed at Station 1 is related to the presence of a significant fraction (38%) of very fine sand (D50=60 µm), a sandy contribution that decreases drastically in the rest of the WGMP. It should be noted that the average POC levels do not show a clear seasonal evolution in the internal area of the WGMP (e.g Stations 3 and 8), while larger seasonal variations of standard deviations suggest a high sedimentary heterogeneity of these sites. Average apparent sedimentation rate are in the range of 0.28 to 0.47 cm/year, with a maximum sedimentation value of 0.9 cm/year at Station 2. We observe the presence of layers of sand and an irregular decrease of 210Pbxs with depth in the proximal area (Stations 1 and 2), indicating higher energy conditions of deposit. On the other hand, the results show that sites close to the depocenter (Station 3) and the distal area of the WGMP (Stations 8 and 4) have a more steady sedimentation regime. Note the good agreement for Station 3 between the profiles measured in the cores collected in 2002 (Rikeau), 2009 (LEVIATHAN campaign), 2010 (BIOMIN campaign) and 2016 (JERICObent campaign), clearly indicating a stability of sedimentary recording at this station.
____________________
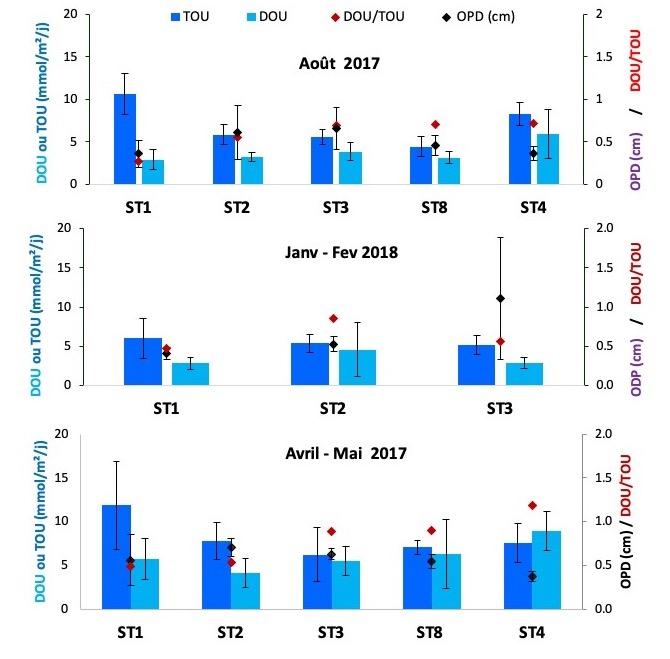
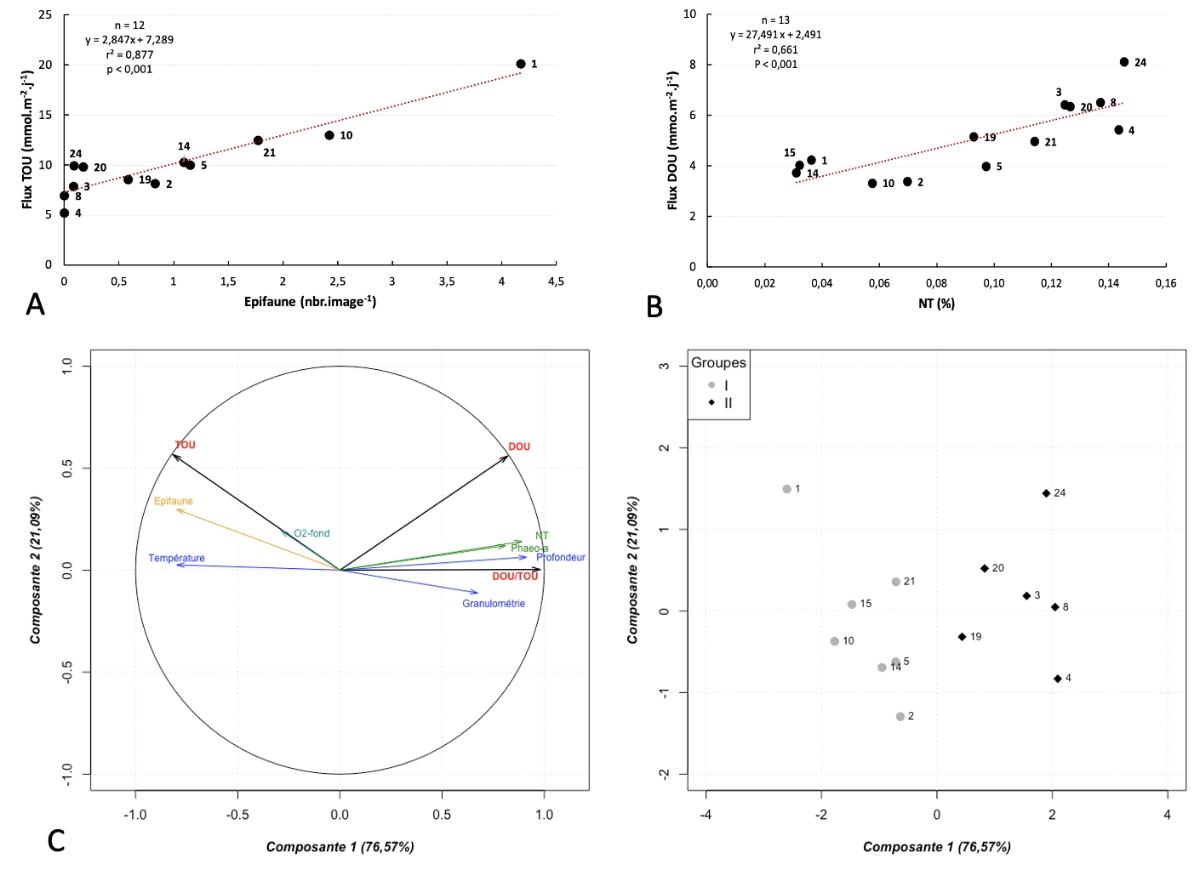
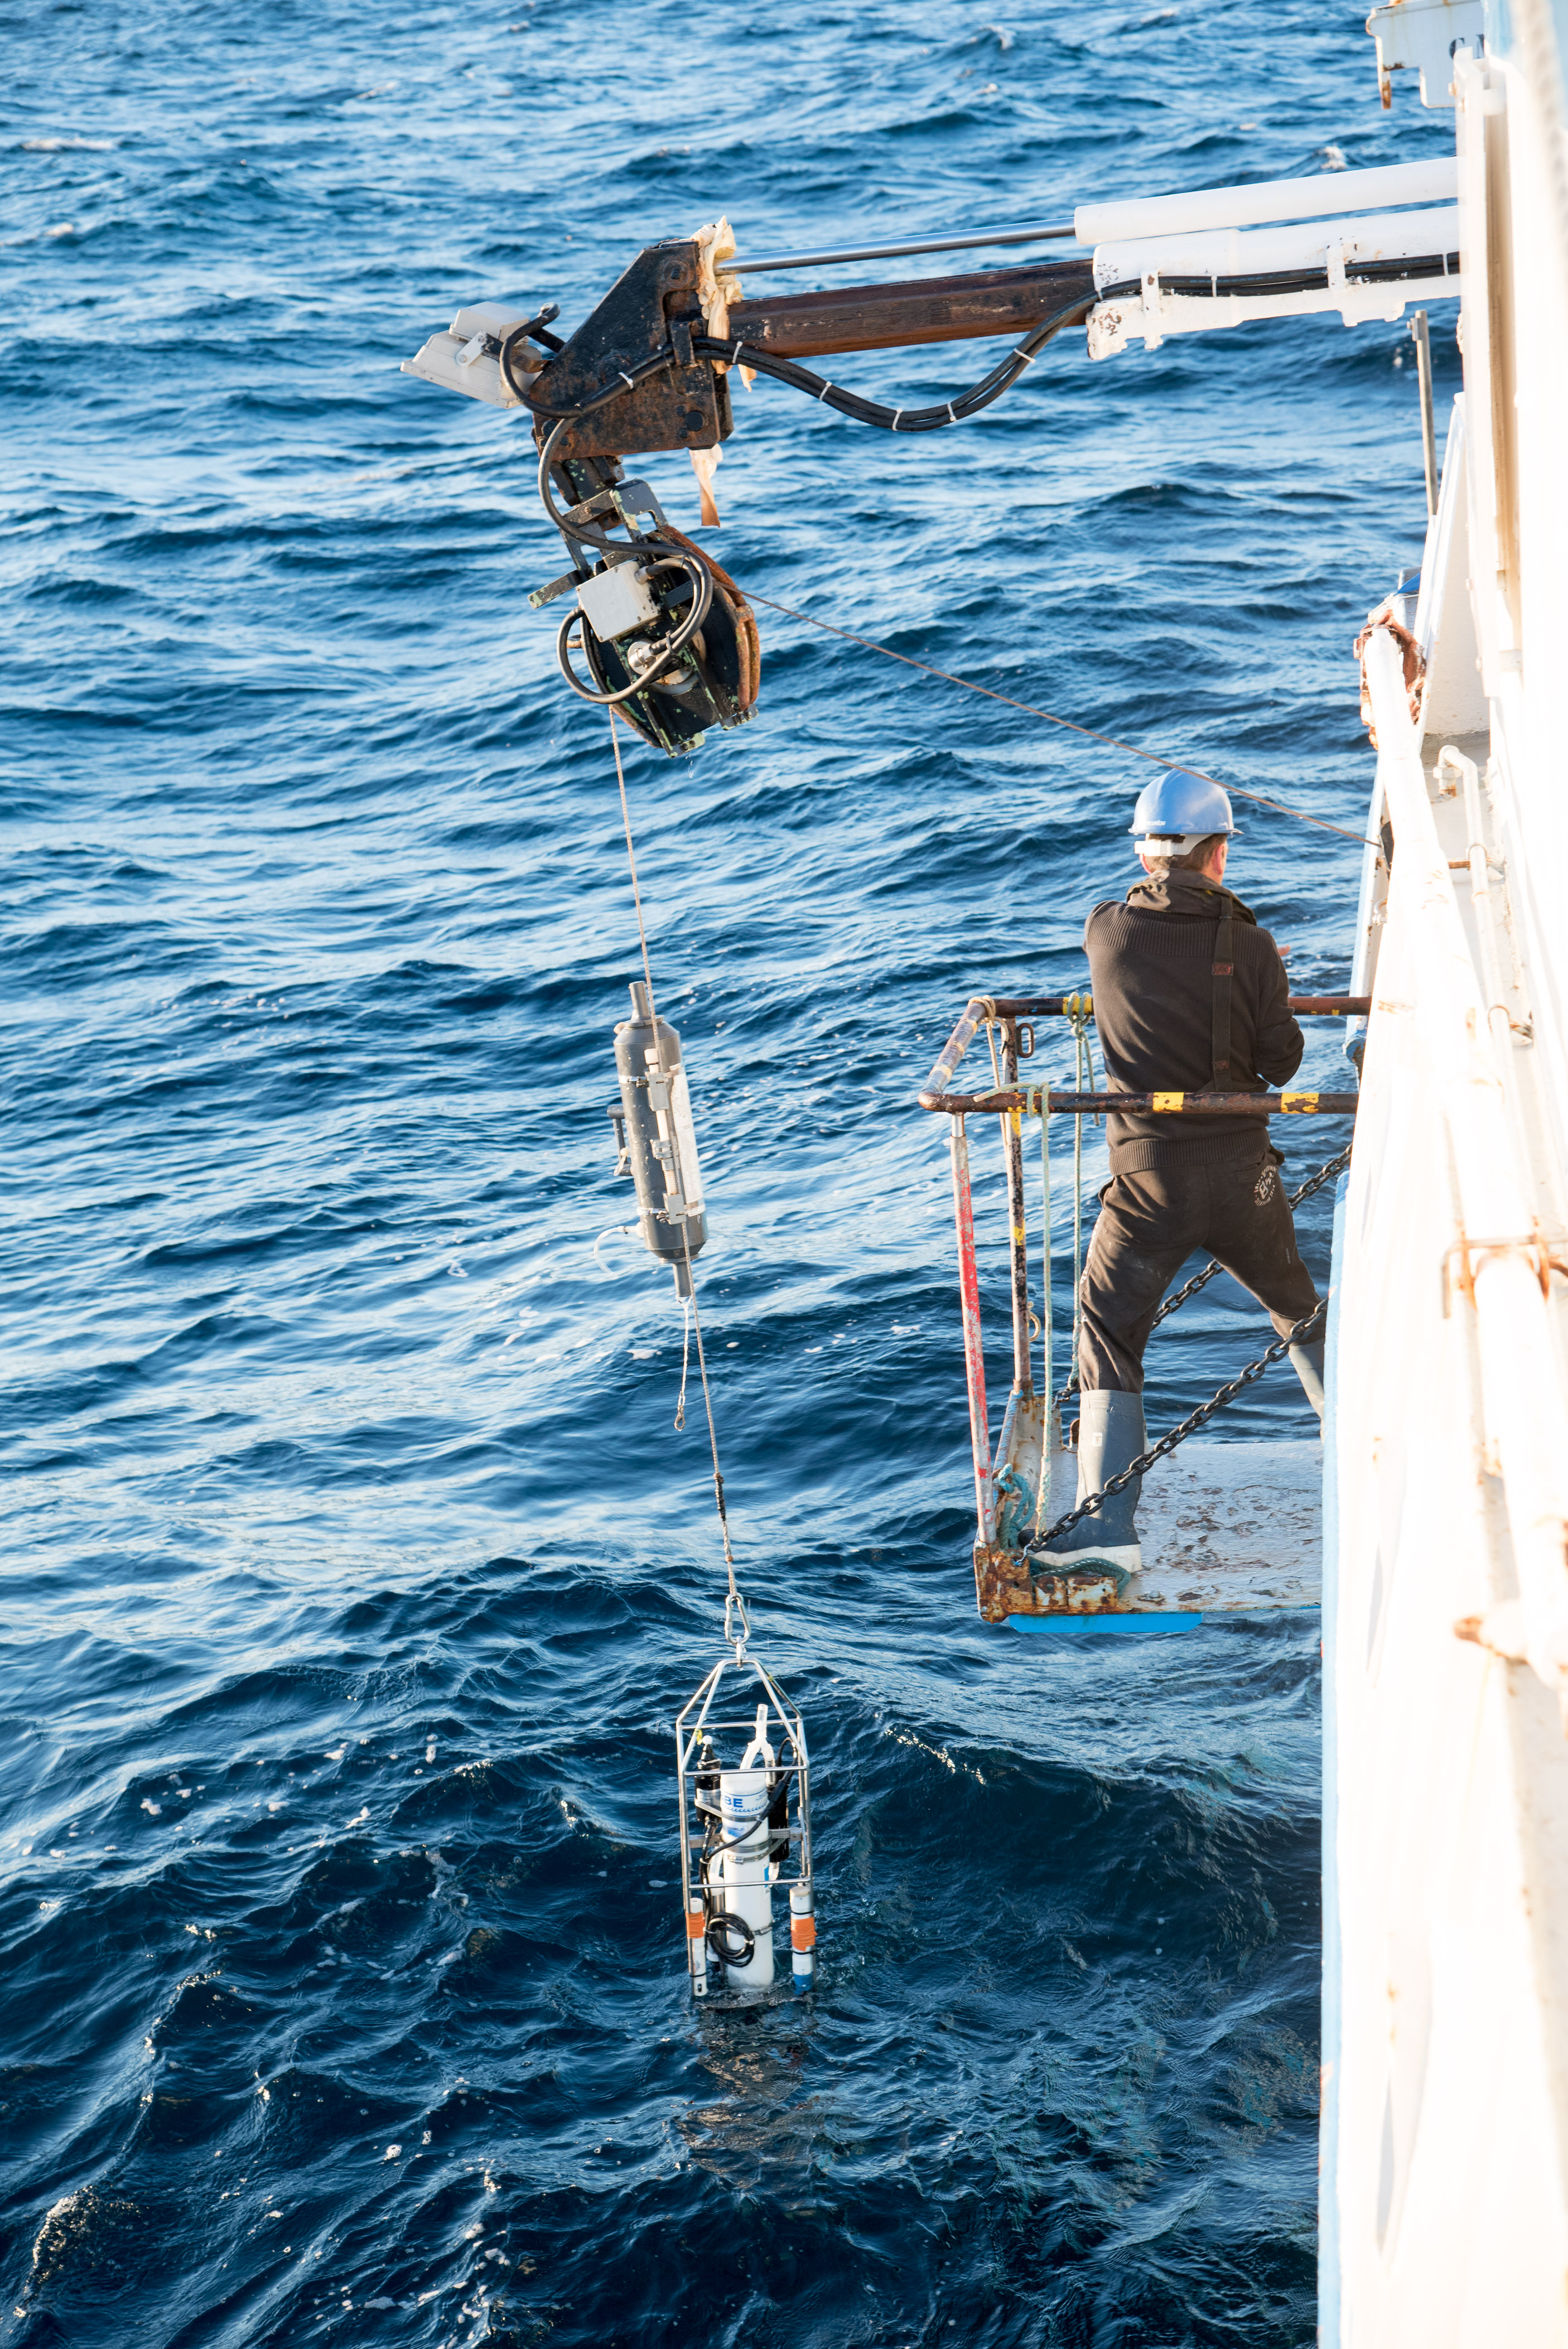
Figure 3 : The sediment O2 consumption rate is a good proxy for the mineralization of OC deposited at the sediment-water interface. The TOU (Total O2 uptake) rates of sites in the internal area of the mud patch (St 2, 3 and 8) are generally similar for the 3 seasons with, values between 4.4±1.2 and 6.0±2.5 mmol m-2 d-1 in summer 2017 and winters 2018, and up to 7.8 mmol m-2 d-1 in spring 2018. On the other hand, stations in the proximal (St 1) and distal (St 4) zones stand out in summer 2017 and spring 2018 with values up to twice higher. The DOU (Diffusive O2 uptake) rates have a similar spatial-temporal pattern with lower values than the TOU and a DOU/TOU ratio ranging from 0.27 to St 1 to 0.9 in the distal zone (St 8 and 4), suggesting the significant role of benthic fauna in the sediment O2 consumption. Note the spatial pattern of DOU rates in the summer 2017 and spring 2018 with a slight increase of St 2 to 4, concomitant with the spatial distribution of the POC. However, the large standard deviations for TOU and DOU rates due to a high level of sediment heterogeneity (at the station level) may explain the difficulty of observing a clear seasonal trend for some stations.
____________________
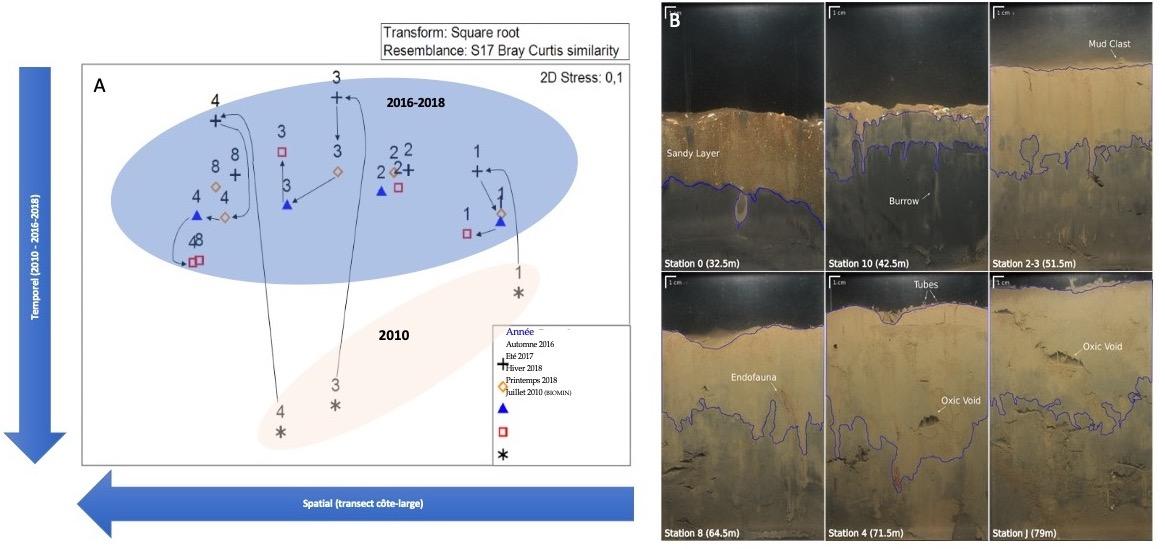
Figure 4: The benthic macrofauna was sampled using a Hamon grab (0.25 m2, 3 replicas/station) and the bioturbation traces were taken using a sedimentary image profiler (SPI, 15 images/station). Figure 4 represents: (A) a non-metric multidimensional scaling analysis (nMDS) based on abundance data from each type of organism sampled between 2010 and 2018, and (B) examples of SPI images along the inshore-offshore gradient. A nMDS was also performed on the characteristics of biogenic structures visible on SPI images with similar results. Coupled with a hierarchical clustering analysis associated with a SIMPROF procedure, the nMDS demonstrates the existence of significant spatial variations along the inshore-offshore axis in the composition of macrobenthic communities. This resulted to separate the WGMP into three bathymetric areas: a proximal zone (station 1), a median zone (stations 2 and 3, where the compositions of the communities are nevertheless different from each other), and a distal zone (stations 8 and 4). The SIMPROF procedure also revealed a significant change in the composition of macrobenthic communities between 2010 and 2016. The relative positions of dots in the nMDS plan suggest that: (1) temporal variations in macrofauna community compositions are significant between 2010 and 2016, (2) the magnitude of these variations is much lower in the proximal zone, and (3) the benthic communities of some stations (1, 8 and 4) seem to describe a return to compositions similar to those observed in 2010. These changes could be attributed to the very strong hydrodynamics caused by successive storms in the winter of 2013-2014 during which the swell may have impacted the benthic habitat of the mud patch up to its distal part. The small variations observed in part proximal are explained by the presence of macrofauna communities more tolerant to hydrodynamics, due to the chronic impact of the swell at these depths.
____________________
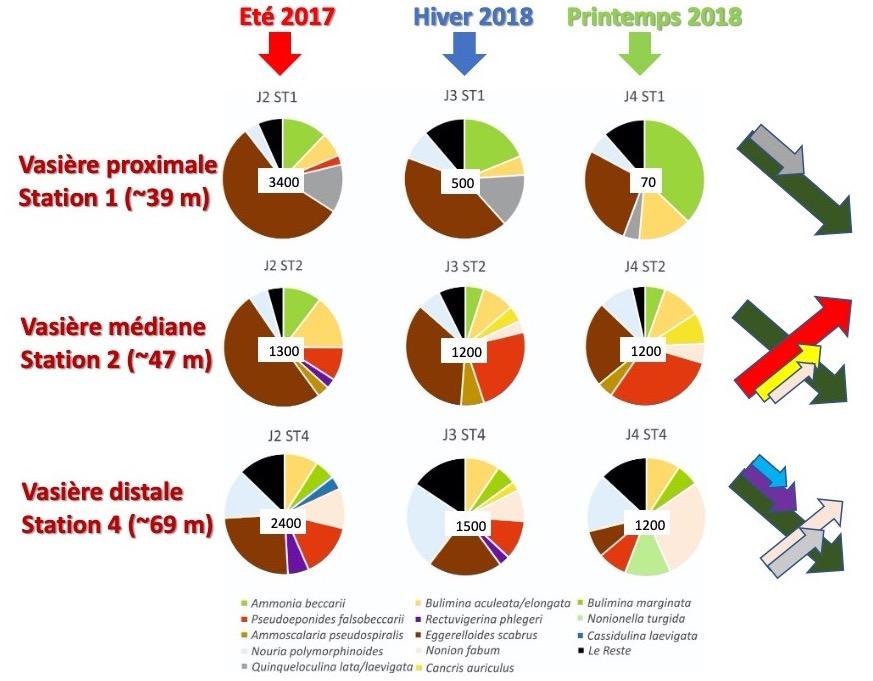
Figure 5: Live (stained) benthic foraminfera from the WGMP are monitored since 2017 (JERICOBENT-2: summer 2017; JERICOBENT-3: Winter 2018; JERICOBENT-4: Spring 2018, 2019 data being processed). Figure 5 shows the preliminary analysis of the abundance of dominant species (2.5%) at stations 1, 2 and 4 over this period. We observe a steady decrease in the numbers and percentages of the agglutinated species Eggerelloides scabrus at all three stations. Alongside this trend, the diversity and total density of benthic foraminifera drop dramatically at Station 1, suggesting the presence of contrasting environmental conditions likely too constraining for benthic meiofauna (sedimentary instability, oligotrophization?). The inter-seasonal variations appear to be the least strong in the internal area of the mud patch (Station 2), although some species (e.g. Pseudoeponides falsobeccarii) are more abundant after the winter than before. At the most distal station (Station 4), the appearance of opportunistic species such as Nonionella turgida in spring 2018 may indicate a beginning of the benthic meiofauna response to the exported inputs of a phytoplankton bloom over the outer shelf.
____________________
Figure 6: The Kullenberg and interface cores were collected from the WGMP in July 2019. However, this campaign was disrupted by sampling misfunctioning and meteorological hazards, which did not fully achieve the programmed work. Only stations 3 and 4 were sampled. Station 1 had a particular sedimentary typology with a very compacted clay from 10 cm under the sediment-water interface (data not shown). Figure 6 shows the vertical profiles of 210Pbxs, TCO2 and NH4+ for stations 3 and 4. Profiles of 210Pbxs in the interface cores show quite regular sedimentation rates of about 0.3 cm/year at both sites. This indicates that the sedimentary archives will have a correct temporal resolution to carry out the investigations of different parameters (geochemistry, microfossils, sedimentology) in order to reconstruct the evolution of this mud patch at time scales from a few decades to a few thousand years. Measurements of 210Pbxs, also taken from the top of Kullenberg cores, were used to interleave the 210Pbxs profiles in both types of cores at sites 3 and 4. The comparison of the 210Pbxs and Th (not shown) profiles indicate that there is a loss of the top of Kullenberg cores of about 20 cm. However, it is possible to interleave these profiles in order to obtain temporal continuity by combining the both cores for the sediment solid phase. This continuity can be found in the vertical distributions of OM remineralization products (i.e. TCO2 and NH4+) in the sediment porewater of Station 3, but the results of Station 4 reveal a discontinuity in the concentration profiles. A higher concentration gradient is observed in the Kullenberg core, suggesting a lower sediment reactivity within the interface sediment core. Station 4 was indeed difficult to sample, requiring up to 4 Kullenberg deployments while the vessel was gradually moving more than 1 nautical miles for the last try located exactly in the axis of the mud patch, where two Kullenberg cores were ultimately collected (3.34 and 3.40 m) at the station named as station 4K. A rapid degradation of sea conditions having promptly interrupted the campaign, it was not possible to recover an interface core at this 4k site. The discontinuity found on dissolved species likely suggests that St 4K has a more reactive diagenetic context in the WGMP axis than on its outer borders, St 4 being on the western edge of the WGMP. This assumption will be verified in future campaigns.
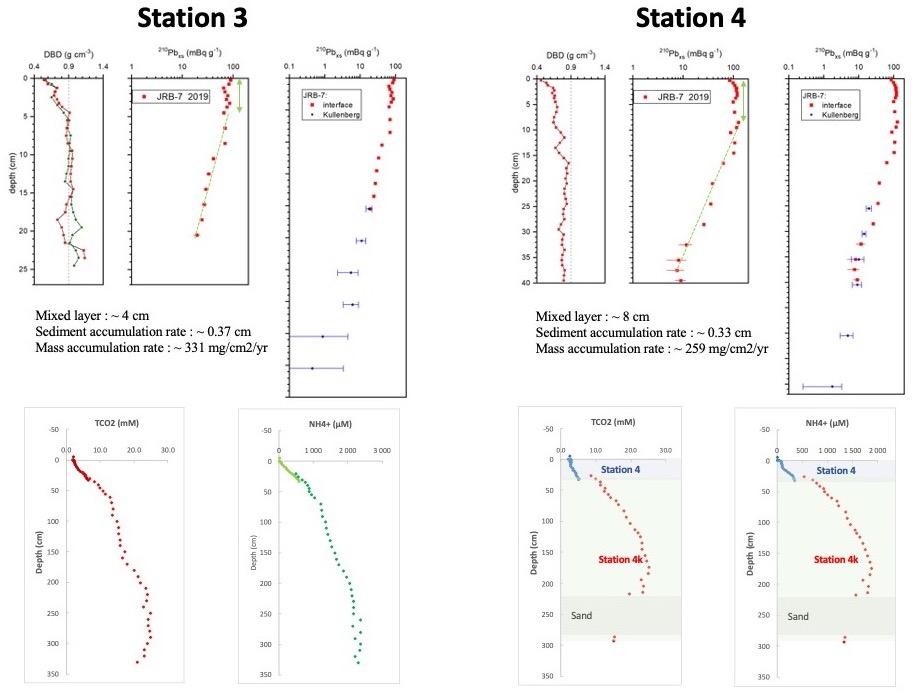
Figure 7: The figure shows the O2 saturation in the bottom waters as a function of the mean temperature above the thermocline. The red dotted line is the threshold of 12.5°C above which thermal stratification occured. The relationship between dissolved oxygen and pH measured simultaneously in Oct 2021 in the VOG waters is presented as well. Despite a discrete sampling strategy integrating several seasons over several years, we have shown the existence of seasonal O2 dynamics with a well oxygenated water column in winter, and then a progressive depletion of the bottom water until reaching a minimum of 45% in autumn (Dubosq et al, 2022). These deoxygenations can be explained by a seasonal strati?cation that isolates the bottom water from spring to autumn, probably reinforced by the advection of deoxygenated water from the north of the Bay of Biscay (Loire, Vilaine) as well as the sedimentation of the organic matter produced in the surface layer and its mineralisation in the bottom water or in the sediment. The positive correlation between pH and O2 (r=0.903, p<0.00) indicates that aerobic respiration (the consumption of O2 associated to the production of CO2) is probably a key process explaining the deoxygenation observed in the VOG, as previously observed on other RiOMars. A better understanding of the processes involved undoubtedly requires better documentation of O2 variability with the implementation of continuous medium- and long-term in situ monitoring to assess the consequences of global change (i.e. PPR RiOMar project).
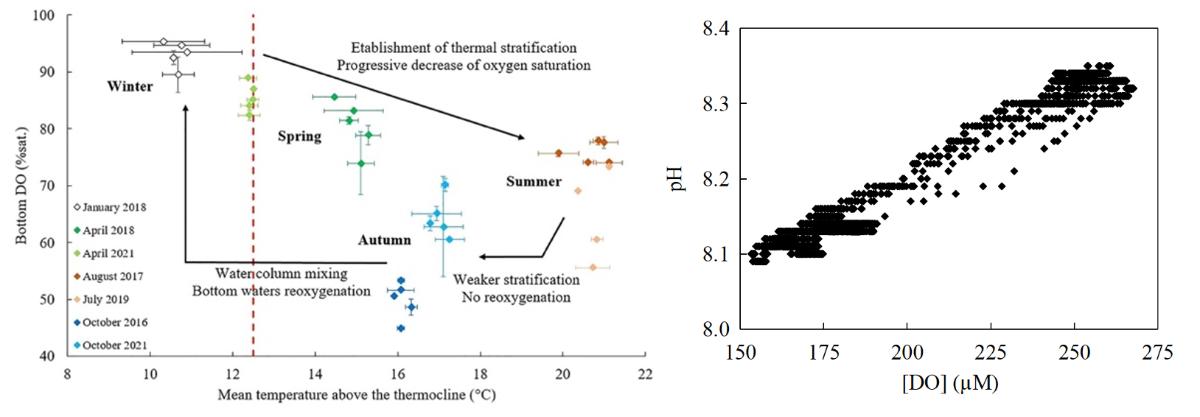
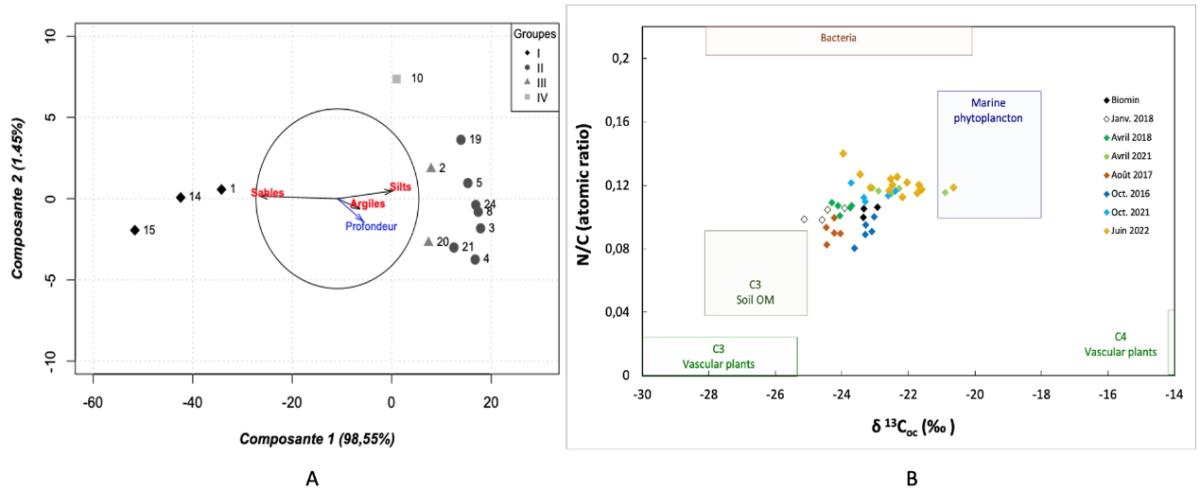
Figure 8A shows the Principal Component Analysis of the particle size composition of the surface sediments collected during the JERICObent-8 cruise. This result can be extrapolated to all the WGMP surveys. Sandy mud was observed at the shallow stations in the proximal zone, while muddy sediments composed of silts and clays were found in the other stations of the WGMP. Figure 9B shows changes in N/C ratios as a function of d13C isotope ratios for all seasonal works between 2016 and 2022 (JERICObent and MAGMA) and 2010 (Biomin). The WGMP sedimentary organic matter is a mixture of terrigenous material from the Gironde and autochthonous marine organic matter produced locally, with marked seasonal variability in these respective contributions of these both sources.
The objective of the JERICObent-8 (Rebirth) campaign was to characterise the spatial pattern of remineralisation fluxes of sedimentary organic matter and to identify the environmental factors controlling variations in total benthic (TOU) and diffusive (DOU) dissolved oxygen fluxes in VOG sediments. Principal Component Analysis of benthic fluxes explained up to 97.7% of their variability (Figure 9C) and showed the important role of epifauna (Figure 9A & C) and temperature on TOU variability in June 2022, while DOU variability was controlled by quantitative descriptors (total nitrogen, pheophytin-a) of sedimentary organic matter (Figure 9B & C).
__________
A WGMP workshop is annually organized in the fall since 2018 by B Deflandre at the Observatoire Aquitaine des Sciences de l'Univers (OASU, Pessac). The aim is to set up a research dynamic promoting scientific exchanges between the various partners of the VOG (EC2CO-LEFE Interface programme; 2017-2020) and MAGMA (LabEx COTE, OFB and Aquitaine New Region; 2020-2023) projects. Many other results than those presented in this summary were proposed during these workshops with 9 talks in 2018 (20/09/2018) and 16 talks in 2019 (19/12/2019) including 2 guest speakers: D Doxaran (CNRS/Villefranche s/mer) and M Diaz (postdocOC IFREMER). The second VOG 2019 workshop was the kick off of the MAGMA project. The next WGMP workshop was initially scheduled for January 2021 but was postponed to January 2022 due to the cancellation of the 2020 campaigns, which have been rescheduled in MAGMA April-May and Oct-Nov 2021 (MAGMA-1 & -2) and June-July 2022 JERICOBENT-8). A WGMP workshop (4 talks) was nevertheless held in July 2021 specifically on the results associated to the Kullenberg cores collected in July 2019 (JB-7).
The JERICObent cruises continued through the multidisciplinary MAGMA project and the MAGMA-1 and MAGMA-2 cruises. In addition to continuing the seasonal characterisation of the biogeochemical and ecological functioning of the VOG benthic habitat as already done with the JERICObent campaigns, the MAGMA project has brought two additional aspects to the characterisation of organic and inorganic contaminants in the sediment and biota (benthos, solea) of the WGMP, and the transfer of sedimentary material from the Gironde to the mudflat and its signature on the continental shelf.
Photographs of JERICObent campaigns for the public at large :
Seabird CTD + O2 and turbidity autonomous loggers to characterize the hydrological context of the WGMP at each time of sampling.
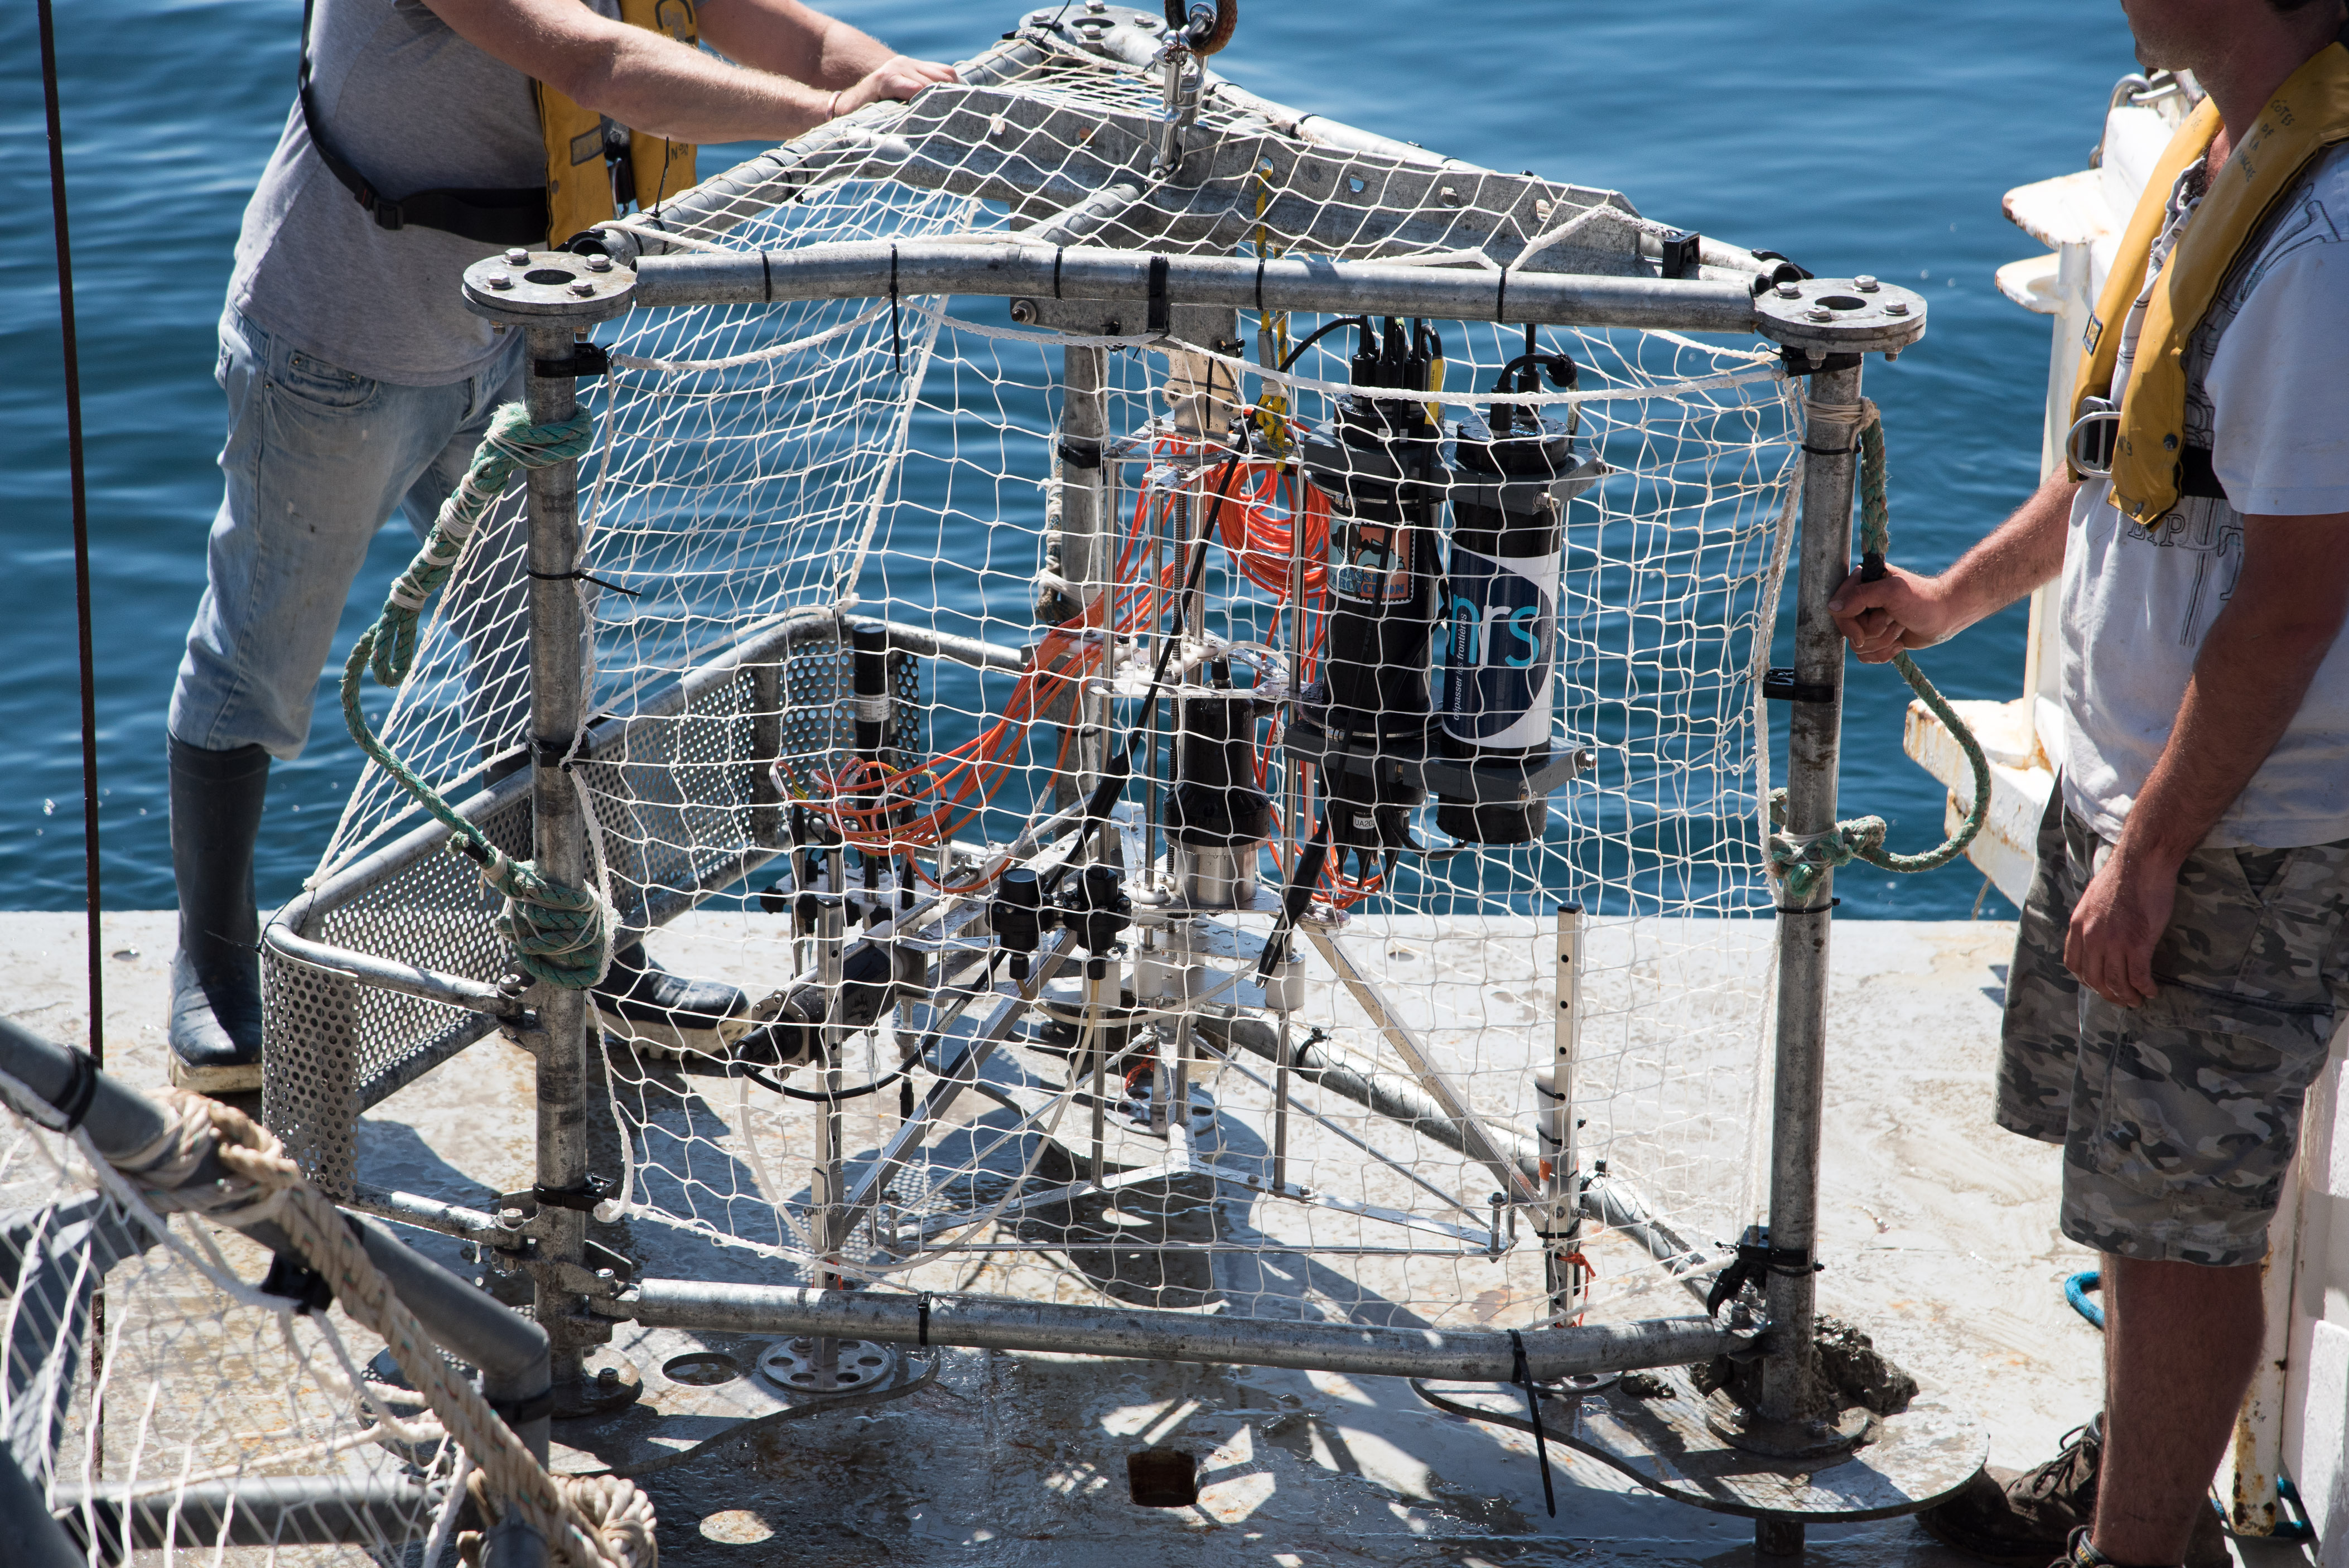
Autonomous benthic observation station equipped with O2 and pH microelectrodes, underwater camera and light system, and various Autonomous loggers (O2, S, T, pressure, tubidity). Deployment from 7-8 hours to 80 m depth.

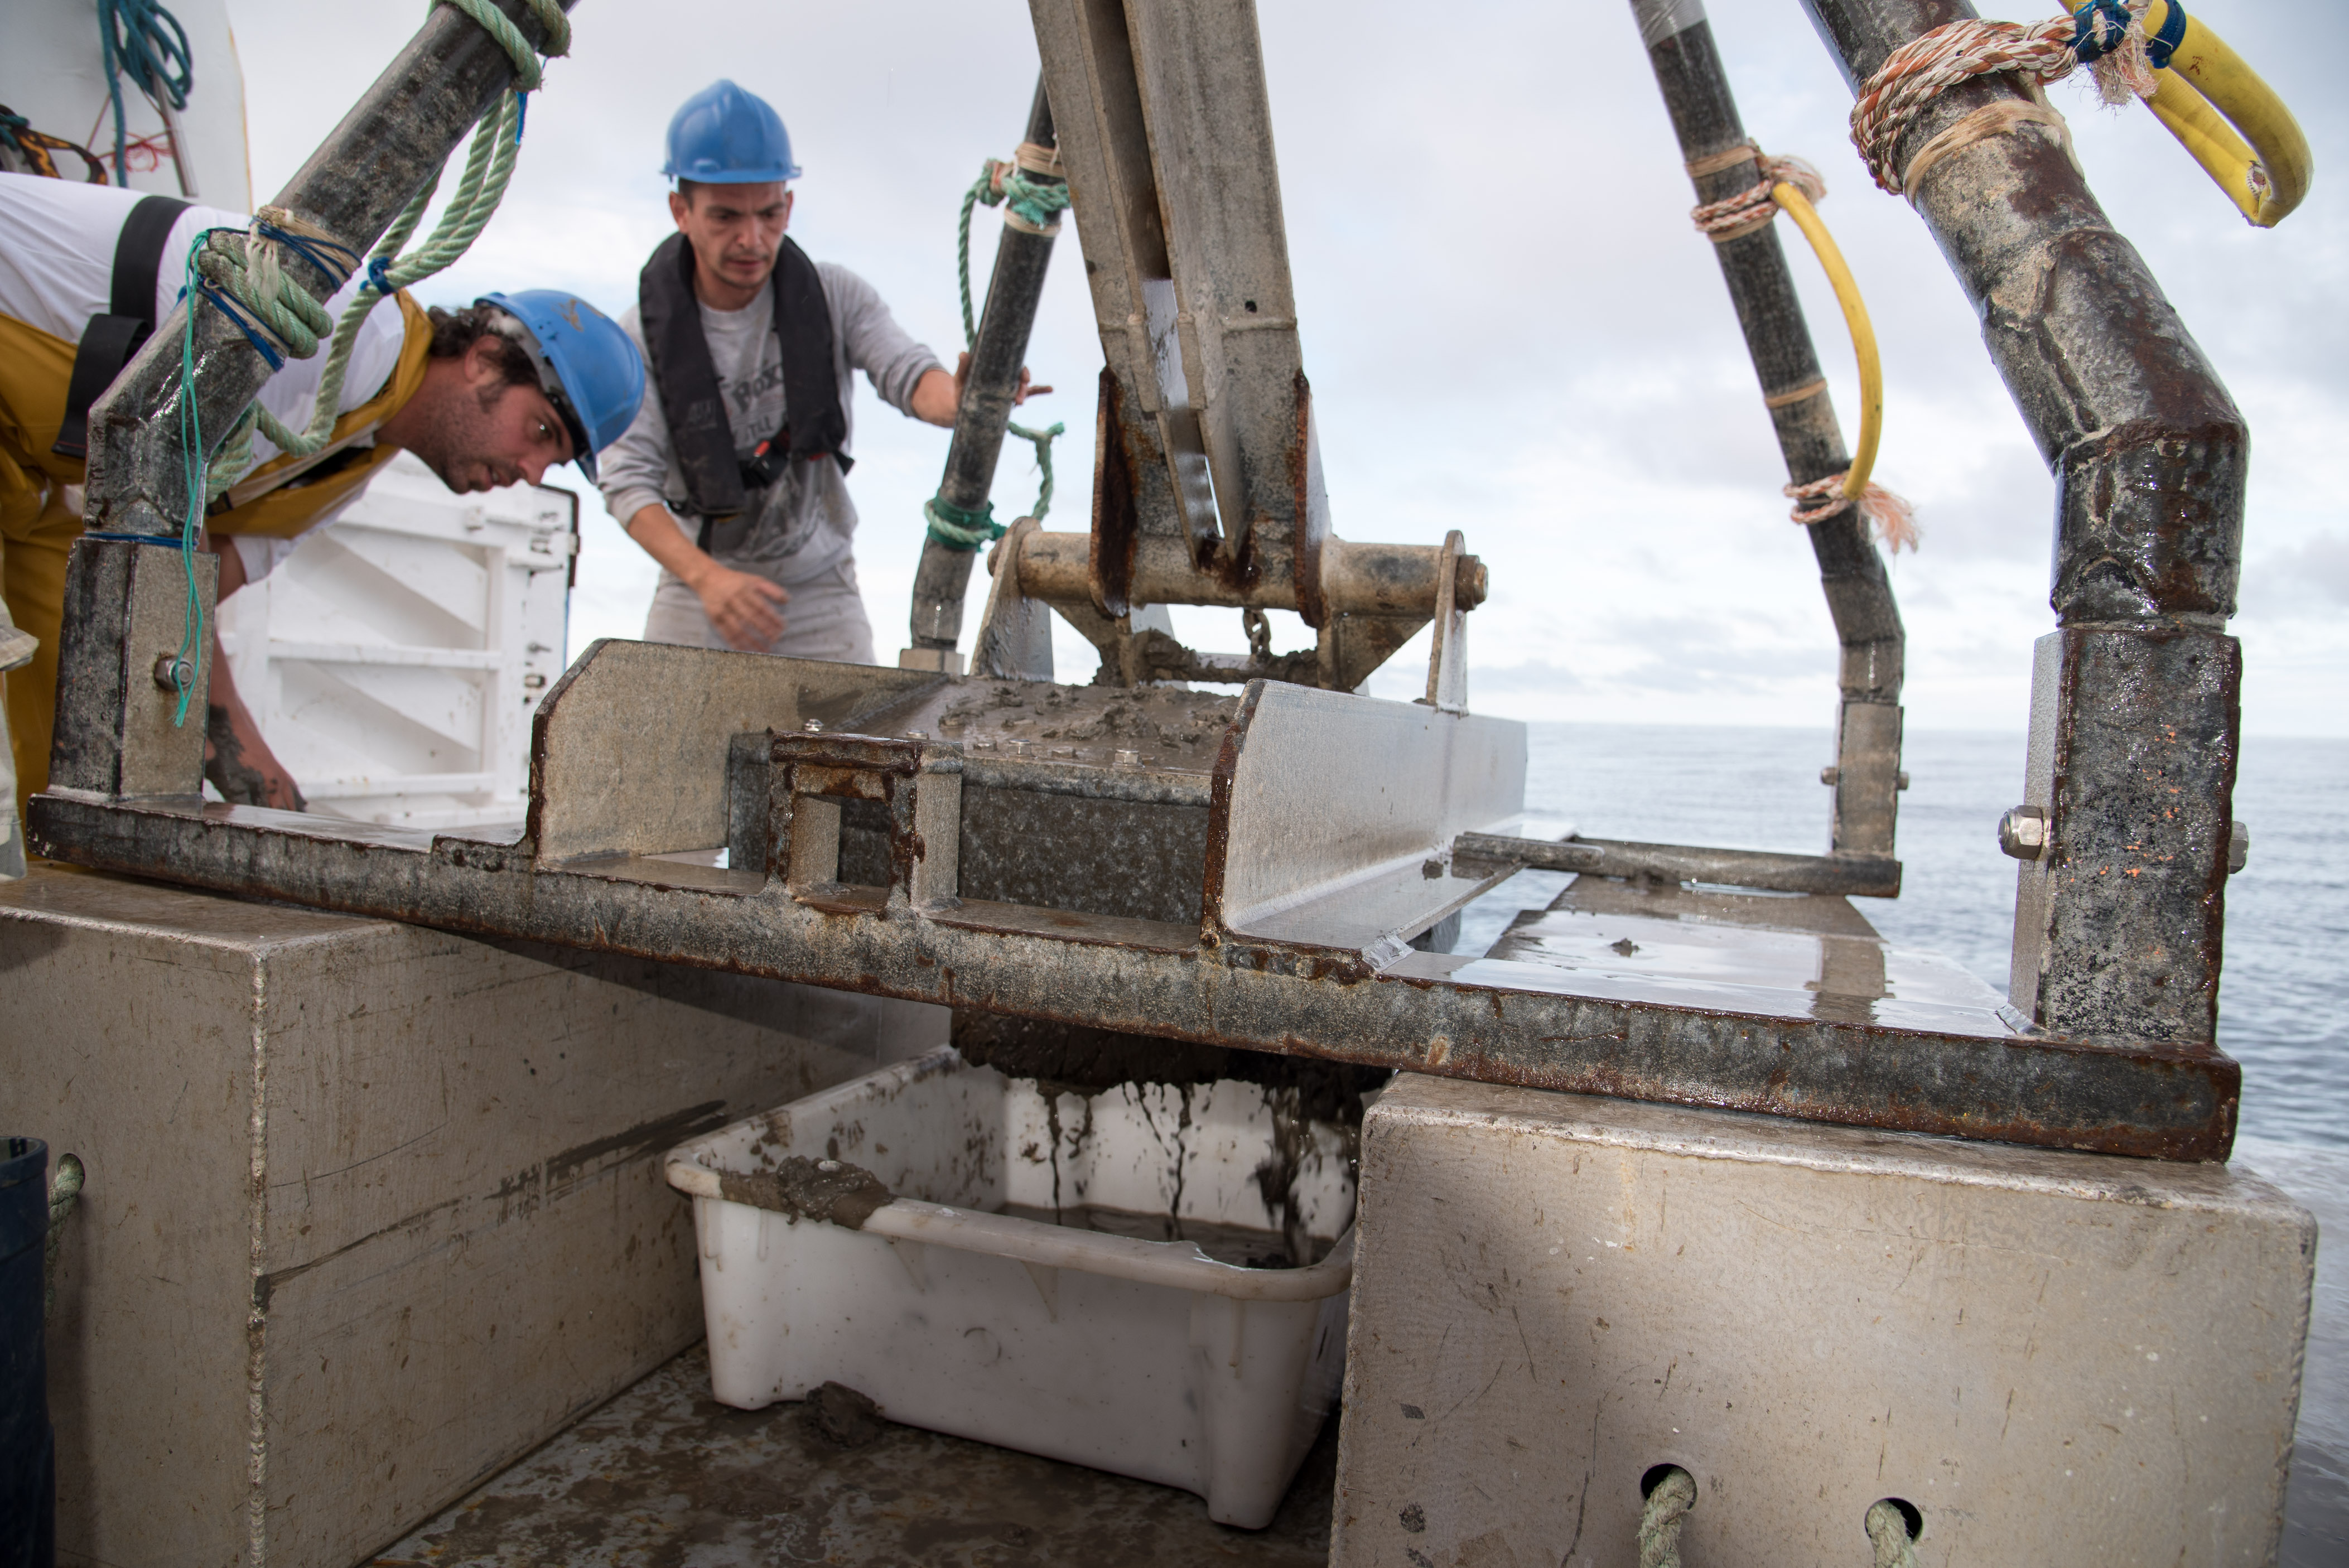
Deployment of the Sediment Profile Images (SPI) profiler.
Sampling of benthic macrofauna using a Hamon grab.