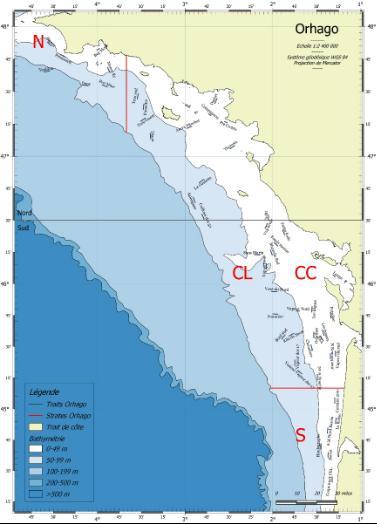
When the ORHAGO campaign was launched, the relevance of an index obtained by fishing during the day compared with one obtained by working at night was a question very often raised by fishermen, as sole is best caught at night. This question had never been considered for other campaigns targeting sole, and the gain made by working at night seemed to have to be assessed on the basis that it was penalising for the duration of the campaign, given the timetable constraints on the research vessels. In addition to the issue of finding the best possible index of abundance, there was also the issue of recognition by fishermen of the relevance of the index of abundance of sole provided by the ORHAGO campaigns and therefore, ultimately, of the value of the campaign via a political process of setting catch possibilities in which the fishermen's point of view is far from indifferent.
To this end, night fishing was programmed for the ORHAGO campaigns with daytime duplication on the same trawl in order to assess the extent of the differences. This work showed that the average catch of sole was twice as high at night as during the day with an otter trawl (Battaglia and Biais, 2007). With a beam trawl, night catches remain higher, but to a lesser extent, at around 10% on average over 2007-2012 (Biais, 2010 and 2012 a and b). However, the impact of the period of work (day or night) on the diagnosis of the state of the stock is low. Changes in spawning biomass and fishing mortality are very similar, regardless of the series of indices used (Figures 1 and 2). This analysis was presented at the WGBEAM in 2013, including an analysis of the effect of not setting up several stations in certain years, usually due to weather constraints (Biais, 2013 a and b). This led to the choice of using the index obtained during the day with 49 reference stations.
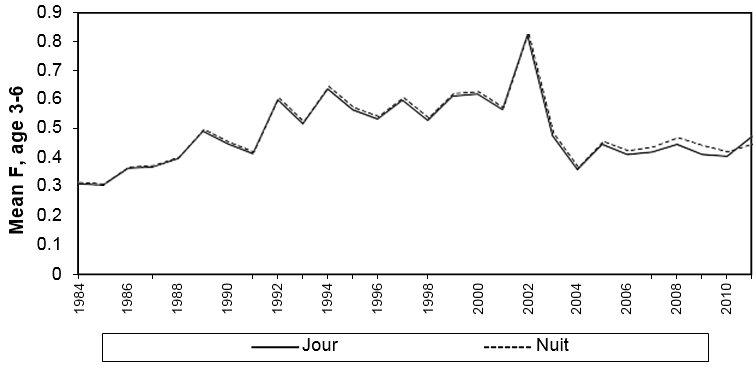
Figure 1: Comparison of estimated fishing mortalities with the abundance indices produced by the ORHAGO day and night campaign.
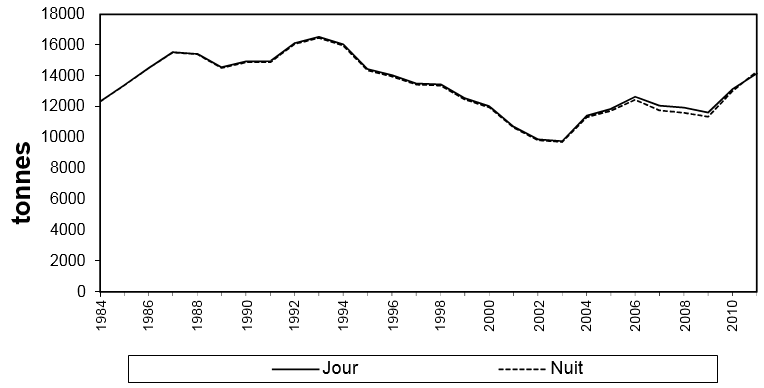
Figure 2: Comparison of estimated spawner biomass with abundance indices produced by the ORHAGO day and night campaigns.
As a result, the age-based abundance index for sole obtained during the day were proposed to ICES for incorporation into the ICES protocol for diagnosing the state of the Bay of Biscay sole stock and the simulations used to advise on the level of exploitation (Biais and Lissardy, 2013). The quality of the series was validated by a benchmark working group, which was able to base its assessment in particular on the good monitoring of the strong year class of fish born in 2007 (Figure 3). The three campaigns carried out from 2012 to 2014 also showed that the weak classes are well monitored, with, in particular, the validation in 2014 of low recruitment at age 2 in 2013. This validation was eagerly awaited, as the succession of two very weak recruitments had never been seen since monitoring of the stock began, some thirty years ago. The ORHAGO campaign is therefore consistent from one year to the next, as can be seen from the two graphs traditionally used to assess the quality of a campaign's indices. The first (Figure 4) superimposes the abundance indices at each age for a given cohort and shows very few irregularities for ages 2 to 4, which make up almost 80% of the exploited stock. The second represents the inter-annual trend in cohort abundance (Figure 5) and shows that irregularities in decline are rare. It is not surprising, therefore, that the ORHAGO campaign have played a major role in the assessment of the bay of Biscay sole stock.
Since 2024, the sole abundance index used in stock assessment has been derived from a statistical model that takes into account spatial and temporal correlations (Figure 6). This approach makes it possible to minimise the impact of stations that were not sampled due to bad weather conditions. This approach also made it possible to improve the consistency of the index for each cohort (Figure 7).
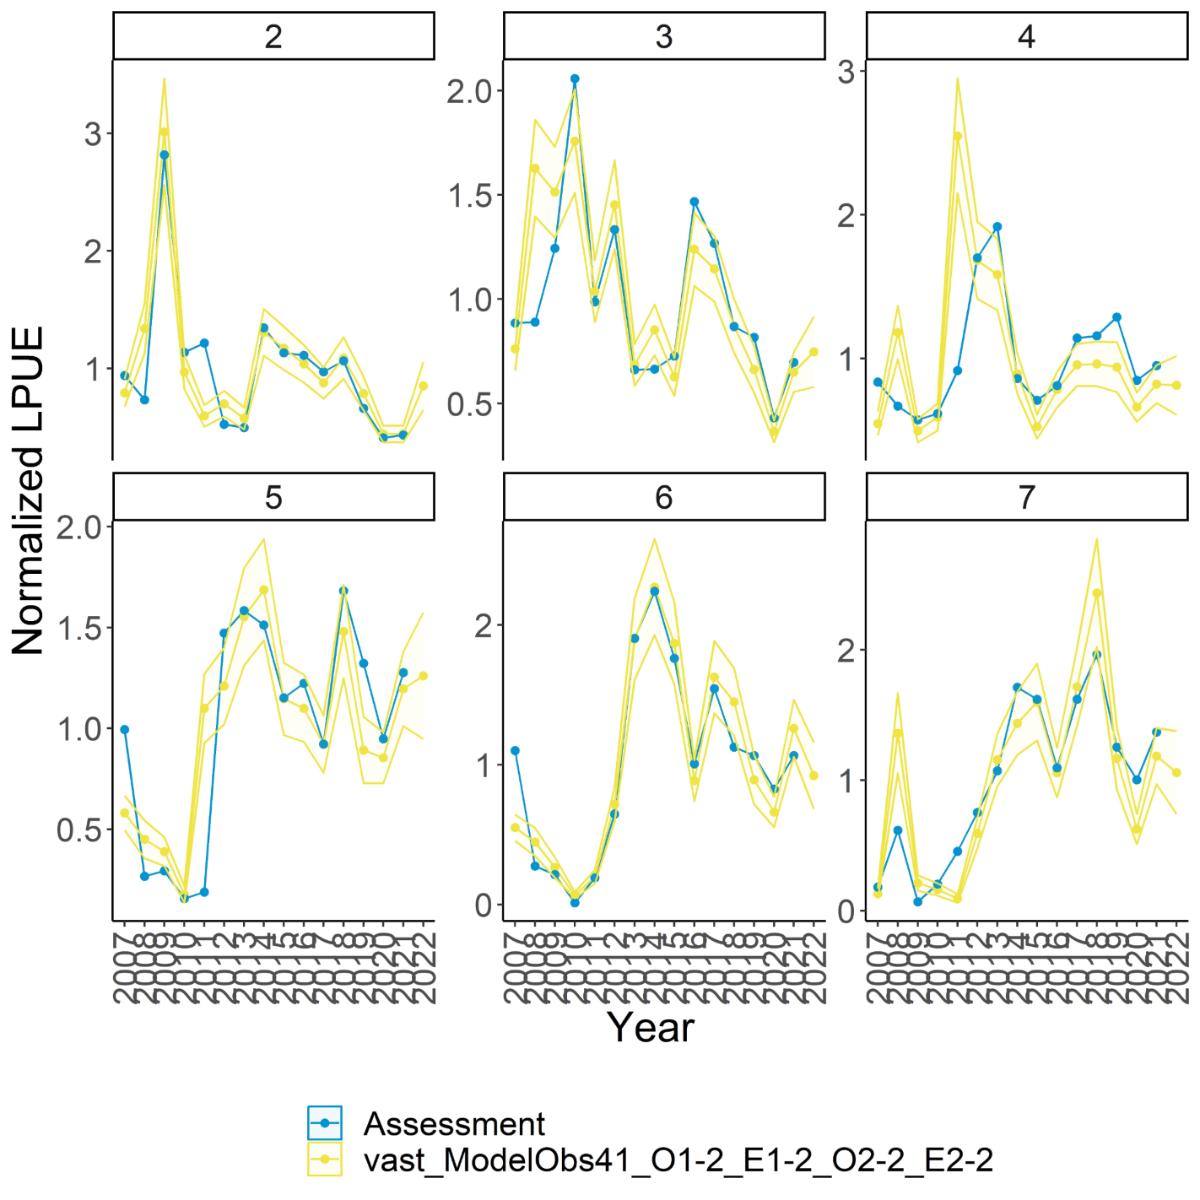
Figure 4: Comparison of the index of abundance by age of sole. In blue, calculation of the index by density before 2023, in yellow calculation of the index by spatio-temporal model since the 2024 benchmark.
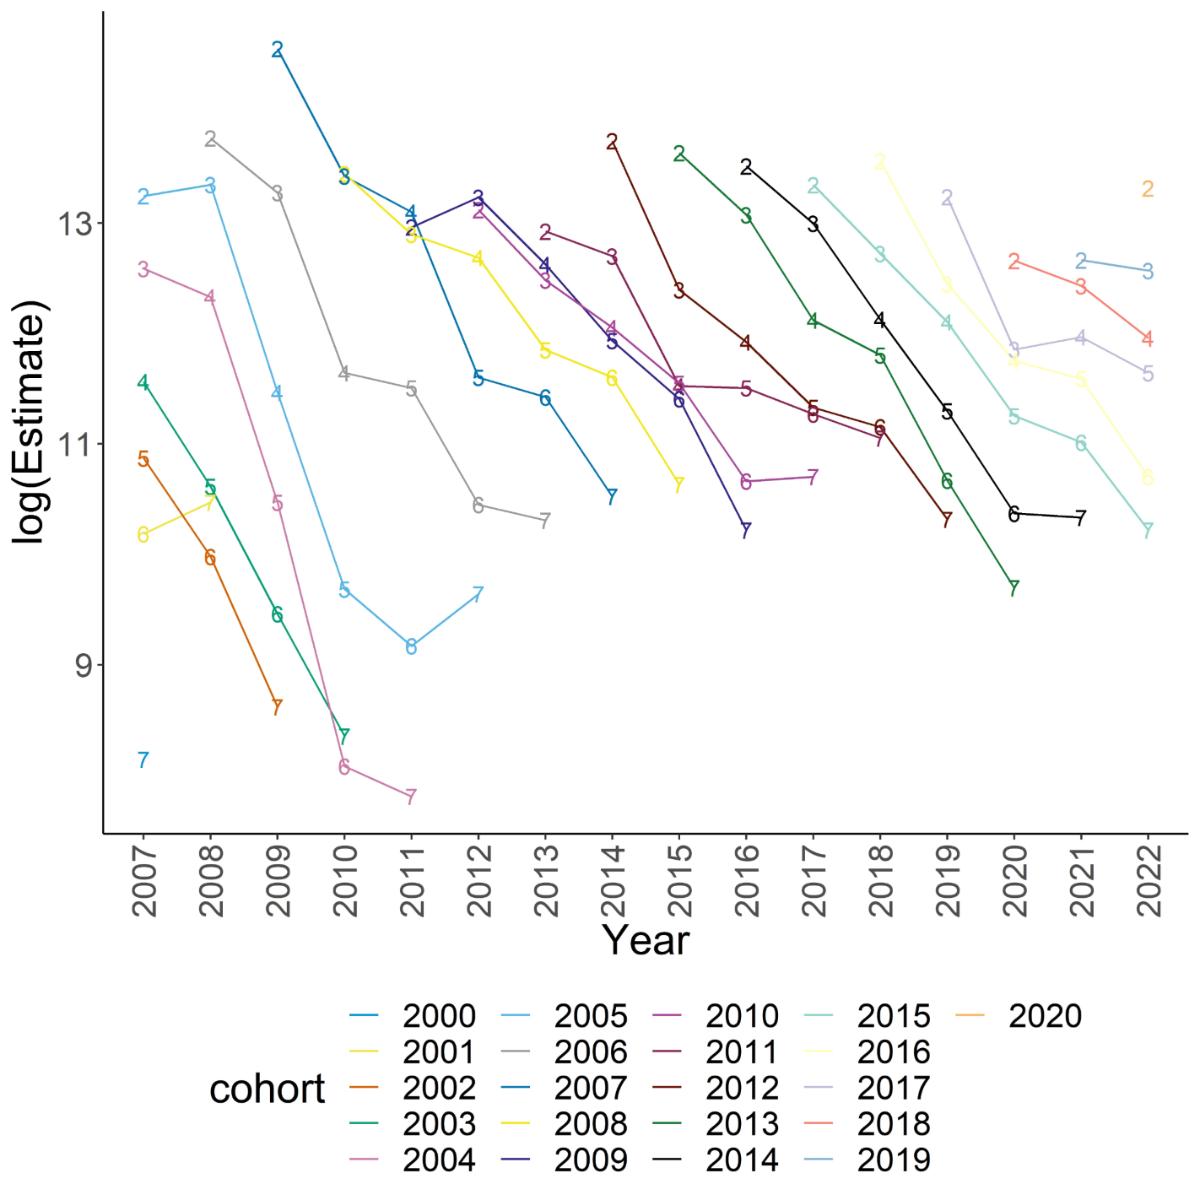
Figure 5: Trends in sole abundance (in logarithms) by cohort with the spatio-temporal model.


