Surface ocean circulation, kinetic and turbulent energy, and island effect: S-ADCP data and SVP drifting buoys (Le Roux C. 2020 ; Castant J., 2020 ; Martinez et al., 2022 - oral com. Maes C.)
The measurements obtained from the S-ADCP (Ship-borne Acoustic Doppler Current Profiler) aboard the R/V Alis allowed for the mapping of currents throughout the campaign (Fig. 4). During the austral summer, the influence of the South Equatorial Current (SEC) appears predominant, with currents mainly oriented westward (NO and SO), contrasting with the situation observed in winter during MOANA-MATY 2018, where surface currents were highly variable (Rodier, 2018).
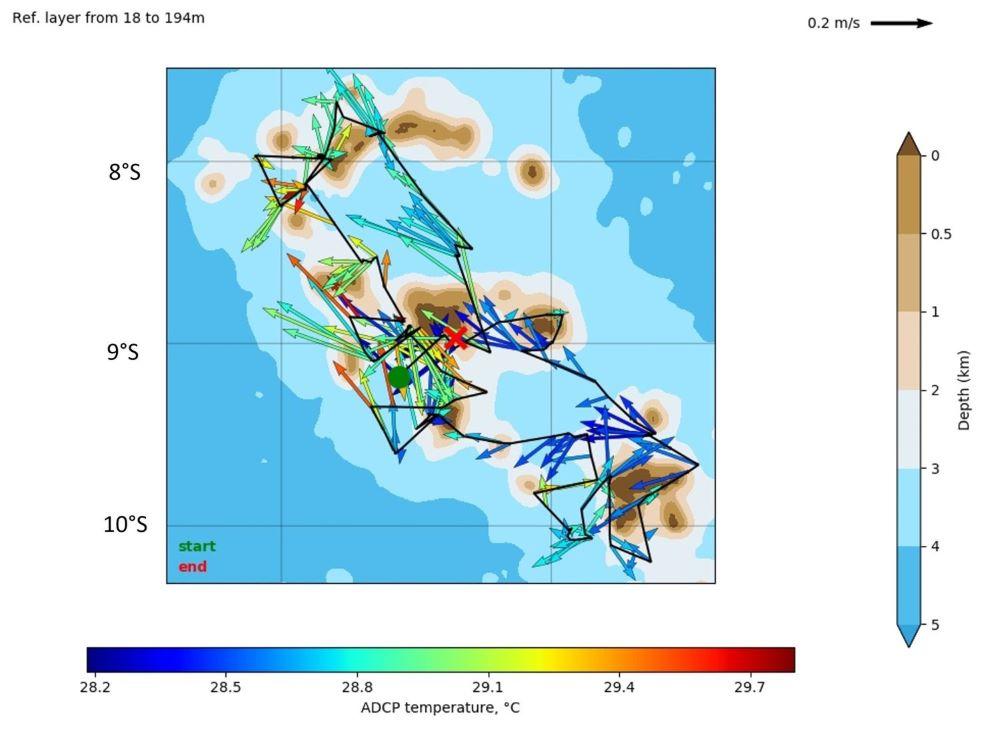
Figure 4. Mean currents during MOANA-MATY 2019 around the Marquesas Archipelago in the 18-194 m layer.
In addition to ADCP data, the analysis of SVP drifting buoy data, particularly those deployed near the islands during the two MOANA-MATY, allowed to define a seasonal climatology of currents, providing a broader context for the campaigns. Over 1,000 buoy-days were recorded in the Marquesas region between 2018 and 2019, including approximately 95 buoy-days per 1°x1° grid cell from January to March 2019 in the area studied during MOANA-MATY 2019 (9°S-8°S, 144°W-141°W).
The SVP buoys deployed during the 2018 and 2019 campaigns showed markedly different trajectories (Fig. 5A), reflecting the seasonal variability of surface currents in the Marquesas region (Fig. 5B). At a finer scale, the SVP data allow to estimate the inter-island flows and their seasonal variability. For example, in summer as during MOANA-MATY 2019 , the current along the northern coast of Hiva Oa is very weak (6.5 cm.s-¹) and flows southwest, unlike in winter. Between Ua Huka and Hiva Oa, the current is southwestward and stronger in summer. Between Ua Pou and Nuku Hiva, as well as north of Nuku Hiva, the current is strong in summer (23 cm.s-¹) but weakens between July and December (from 12 to 14 cm.s-¹).
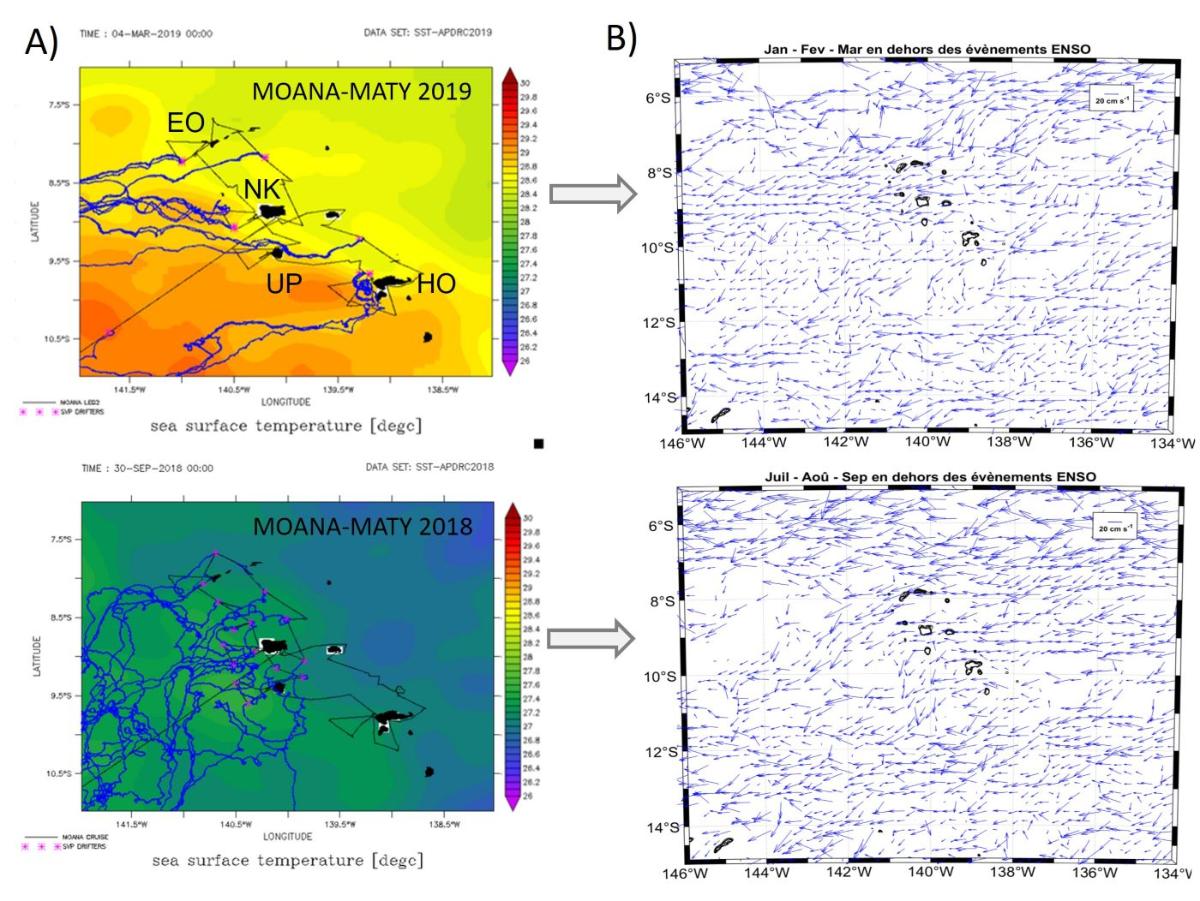
Figure 5. A) Trajectories of SVP drifting buoys deployed during MOANA-MATY 2018 and 2019; B) Seasonal climatology of surface currents for the 1979-2019 period, calculated from SVP buoys, including those deployed during the campains. Spatial resolution is 1/4 degree. Only summer and winter results are shown, corresponding to the MOANA-MATY.
From the analysis of SVP data it is also possible to define certain characteristics related to the island effect, such as mean kinetic energy (MKE) and eddy kinetic energy (EKE). The MKE around the Marquesas varies seasonally, similar to the current patterns (Fig. 6A), ranging from 120-175 cm².s-² during the austral summer (MOANA-MATY 2019) to 150-180 cm².s-² at the end of winter (MOANA-MATY 2018). It is consistently lower downstream of Hiva Oa than upstream and higher in the northern part of the archipelago compared to the south, with summer maxima north of 7°S (>400), characteristic of the equatorial zone. The analysis of the EKE/MKE ratio (Fig. 6B) helps to identify areas where turbulence is predominant, such as in the southern part of the archipelago and downstream of the islands (W-SW). However, the Marquesas Archipelago is located in a region where this ratio is relatively low (< 2 on average, with a maximum of 5.4 SW of Nuku Hiva in summer), compared to significantly higher values found further south (30 to 100, south of 30°S).
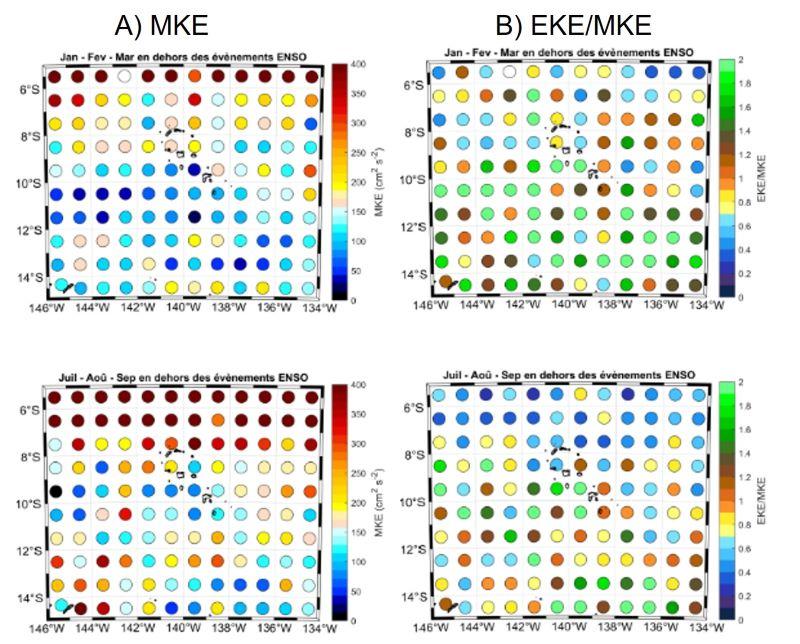
Figure 6. A) Mean kinetic energy (MKE) and B) EKE/MKE ratio for the period 1979-2019, calculated from SVP data. Results are only shown for summer (top) and winter (bottom), corresponding to the two MOANA-MATY. Spatial resolution is 1 degree.
These results on ocean dynamics (ADCP, SVP) will be complemented by data from SPASSO (Software Package for Assimilation of Satellite data in Oceanography). Maps from Lagrangian diagnostic are already available on the SPASSO website (https://spasso.mio.osupytheas.fr/MOANA_MATY/Figures_web/), but it will be necessary to extend these Lagrangian experiments (study of fine-scale processes, eddies, internal waves) to define the fate and origin of enrichments and their links to the islands (coll. S. Barillon, A. Petrenko, MIO).
Biomasse, production and composition of phytoplanktonic communities (Charavit J., 2019 ; Martinez et al., 2022 - oral com. Rodier M. ; Layec et al., 2023)
Phytoplankton biomass and production (Fig. 7). During MOANA-MATY 2019, surface Chla enrichments were concentrated downstream of the islands, particularly southwest of Nuku Hiva, with concentrations reaching 1 mg.m-3 in the first 30 meters. Conversely, areas upstream of the islands showed little enrichment and a deepening of the chlorophyll maximum (DCM) (> 60 meters, up to 106 meters at St. 6). This situation differs from that observed during MOANA-MATY 2018, where the upstream/downstream contrast was not marked, which may be linked to variation in current climatology (Fig. 5).
Chla biomass is largely dominated by picoplankton (< 2 µm) and picocyanobacteria, except in the enriched areas SW of Nuku Hiva, where 50% of the Chla is made up of organisms > 10 µm, linked to the development of diatoms (see chapter below). Off Hiva Oa, the enrichment seems to be linked to smaller, pico- and nanoplanktonic organisms (including dinoflagellates), indicating different stages in the evolution of the system.
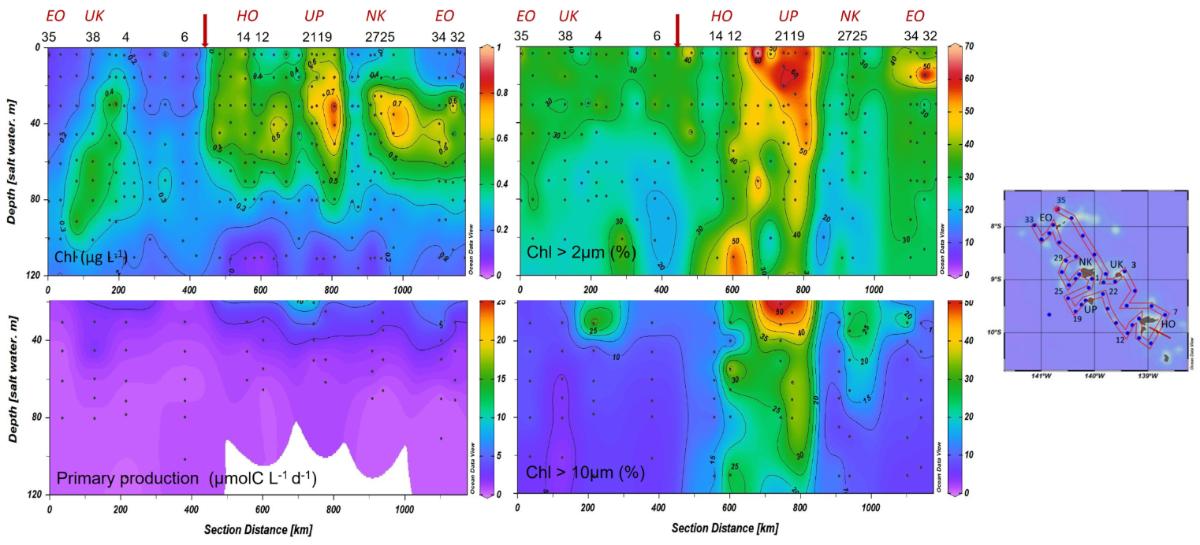
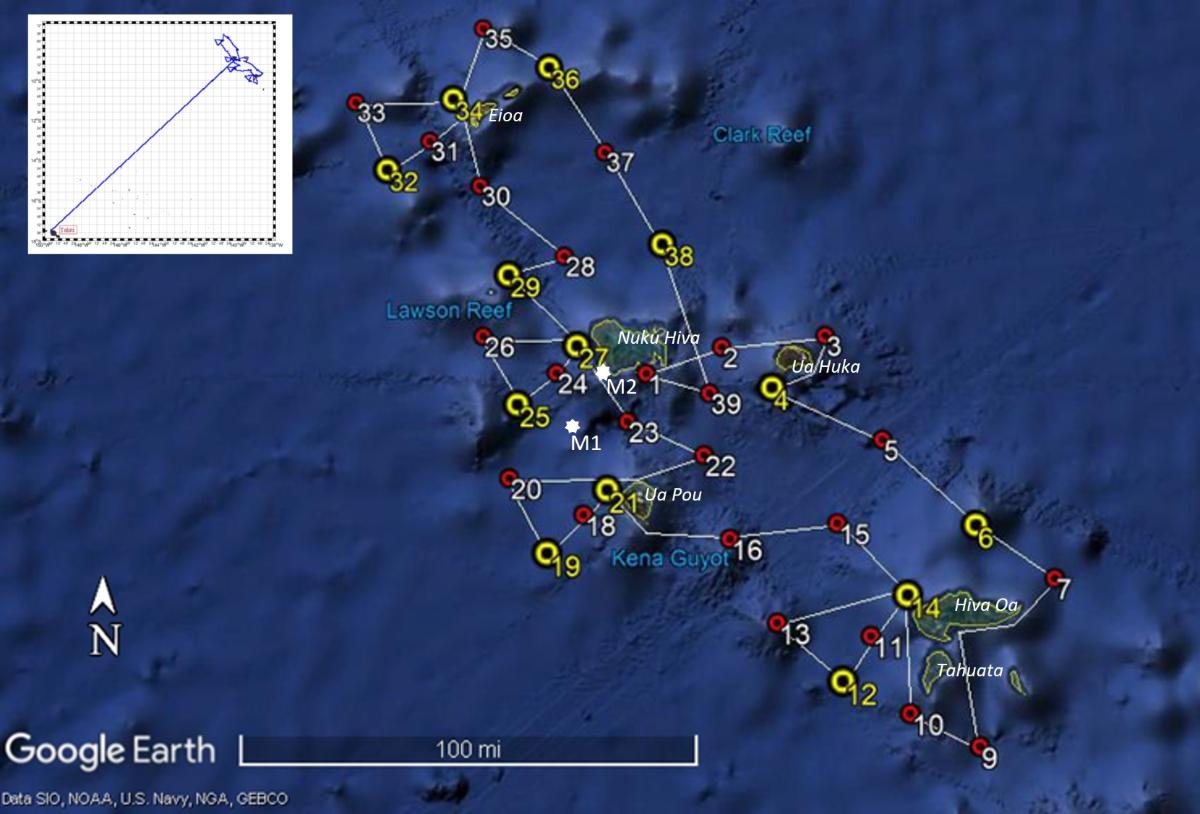
Figure 7. Distribution of total and fractionated Chla (>2 and 10µm)) and primary production during MOANA-MATY 2019. Distance refers to the distance along the route indicated on the map. EO (Eiao), UK (Ua Huka), HO (Hiva Hoa), UP (Ua Pou), NK (Nuku Hiva)
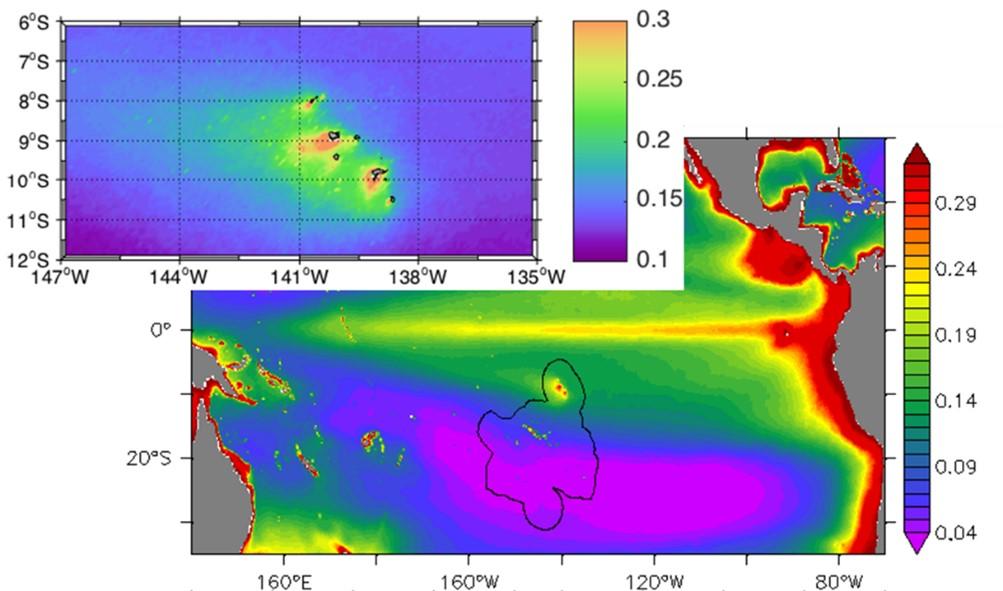
Integrated Chla values on the euphotic layer (0.1% light) range from 18.1 to 52.7 mg Chla m-2 (33.1 ± 9.0 mg Chla m-2) and are associated with primary production values ranging from 56 to 433 mgC m-2 d-1 (219 ± 103 mg C m-2 d-1) and maximum at the surface (0-20/30m). These values confirm the mesotrophic character (HNLC type) of the Marquesas archipelago's ocean waters, as already observed during MOANA-MATY 2018. The pelagic ecosystem surrounding the Marquesas Archipelago thus appears to be a productive HNLC-type system whatever the season, but highly dynamic as evidenced by satellite images obtained during the cruise (Fig. 8).
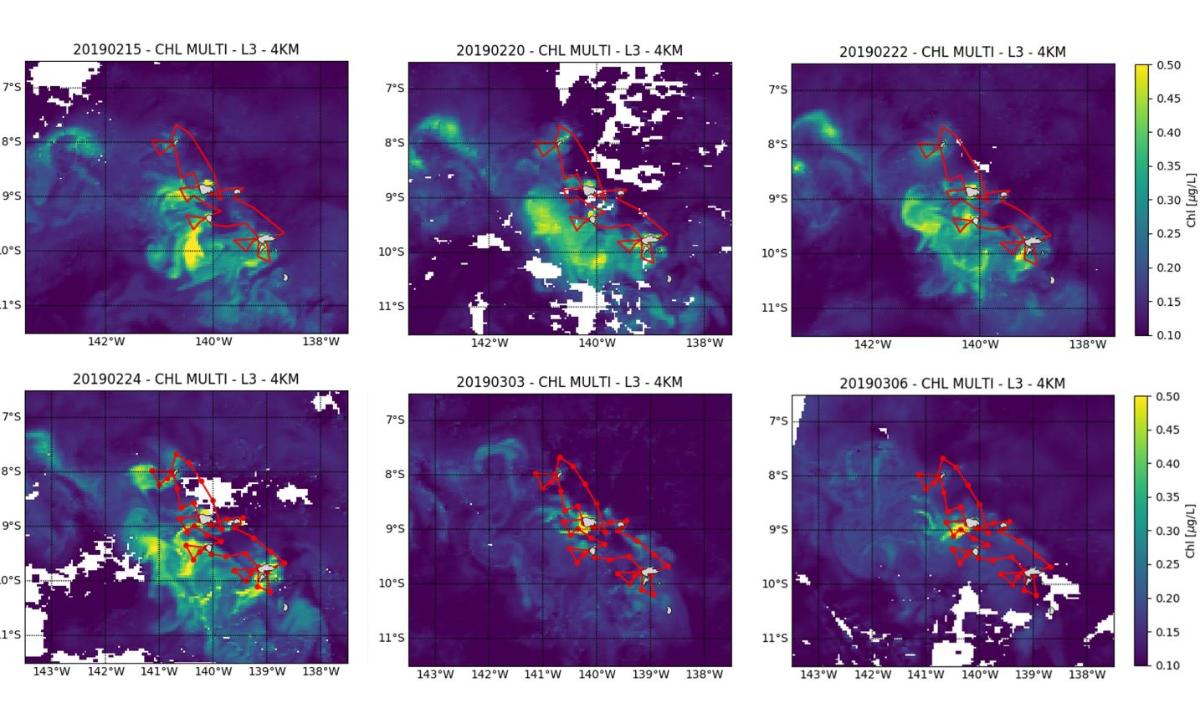
Figure 8. Chlorophyll map (µg L-1), derived from GlobColour satellite data (MERIS/MODIS/VIIRSN) during MOANA-MATY 2019.
Nano-microplankton community composition (microscopy and metabarcoding). Analysis of nano- and microphytoplankton composition was carried out using optical microscopy coupled with a metagenomic approach at long stations. Pigment data using HPLC will complete this quantitative study of phytoplankton community structure.
a) Microscopic observations reveal changes in communities within the archipelago, associated with great variability in terms of abundance (Fig. 9). Flagellates dominate in diversity, represented by two main groups : Prymnesiophytes (16 species/genres) with a dominance of the genus Gephyrocapsa, and Dinoflagellates (78 species). Diatoms (64 species) are particularly abundant in the rich zones located downstream of the islands, with high surface values at Sts 19 and 25, stations located 85 and 55km from the islands.
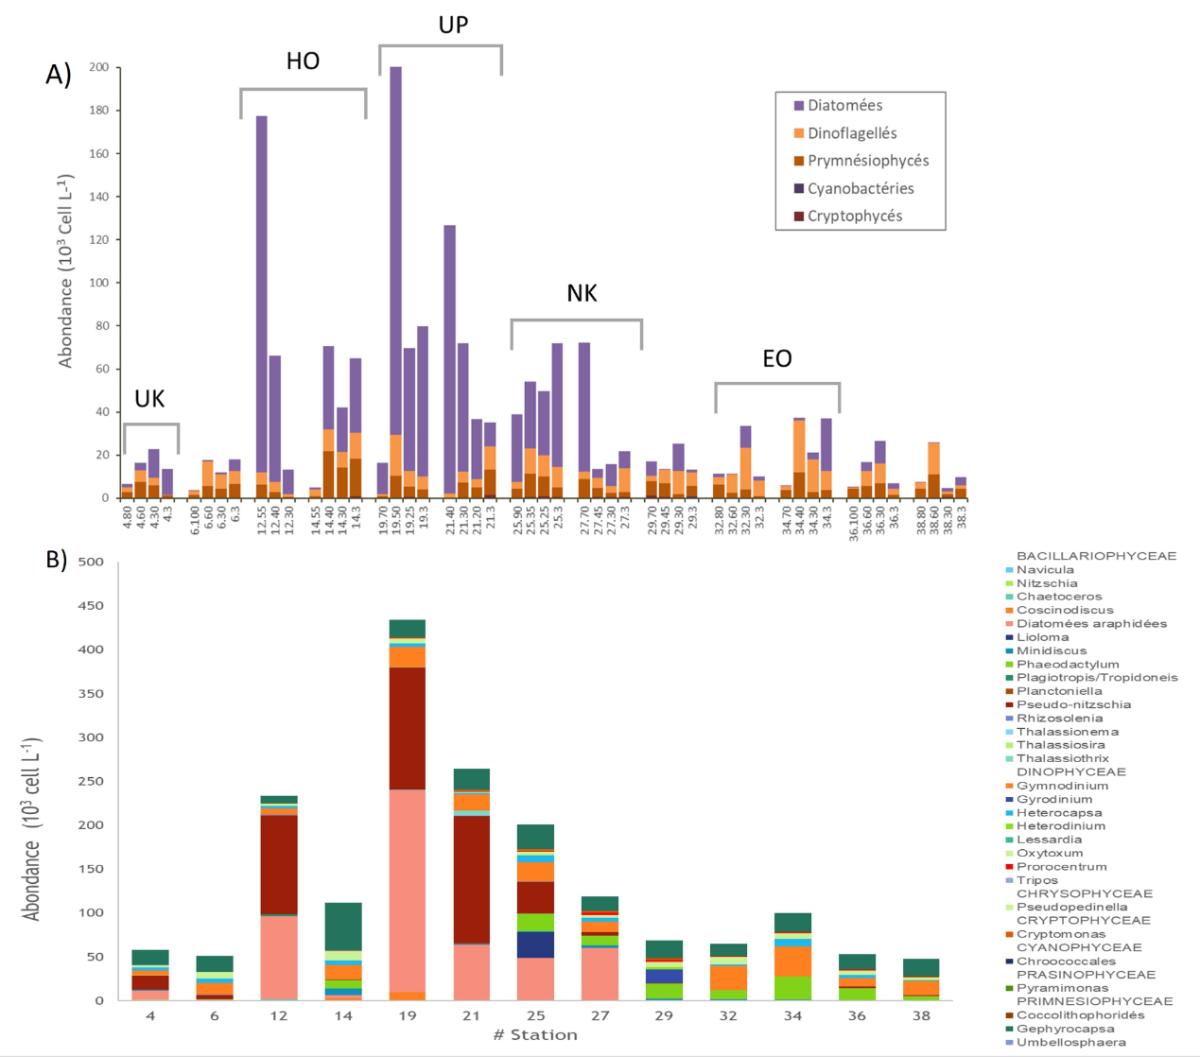
Figure 9. A) Distribution of major taxonomic groups across the euphotic layer during MOANA-MATY 2019 (inverted microscope observations). Around the islands, the most coastal stations are on the right in each box. B) Main genera present in the water column.
b) The addition of metabarcoding data during MOANA-MATY 2019 enabled a more detailed characterization of community structure and composition at the surface and within the deep chlorophyll maximum (DCM). An first analysis of the data was carried out on samples > 3µm, distinguishing three clusters, Upstream (U), Coastal (C), Dowstream (D), a classification likely to evolve in the future. The analyses are based on the relative abundances of DNA sequences obtained after sequencing, expressed in "reads" or ASVs after data processing.
Across the archipelago, dinoflagellates are the dominant group (up to 50% of reads), followed by diatoms (up to 30%), which is consistent with microscopic observations. At the surface, the stations located upstream of the islands (Sts 34, 36, 38 and 6) have the highest specific richness (between 700 and 800 ASVs; Fig. 10). The other stations have generally lower richness, with minimums at Sts 14 and M12, and very few ASVs in common with the other stations. Diatoms are the only surface group to show a positive relationship between the abundance of reads and distance from the coast (linear model, p-value < 0.05).
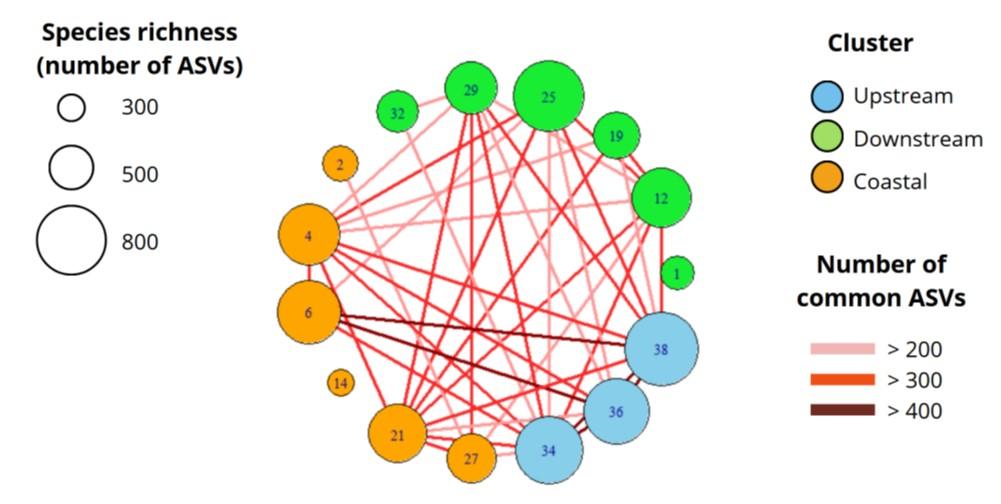
Figure 10. Surface species richness by station and number of shared ASVs. 1= M1
Metagenomic and microscopy data show an inverse relationship between specific richness and diversity (Shannon index) and Chla concentration (p-value < 0.05), in agreement with theoretical models. However, no clear "camel-back curve" pattern (Torok et al., 2016) emerged for the data set. Diversity indices vary between metagenomics and microscopy. On the basis of metabarcoding data alone, which provide a more detailed description of specific diversity, upstream stations show greater species diversity (Fig. 11A). In contrast, the lowest diversity is observed at the downstream coastal stations Sts 14 and M1.
The NMDS/Dissimilarity analysis by Bray-Curtis enabled us to visualize and quantify differences between stations in terms of specific composition (Fig. 11B). The stations upstream of the islands (U) appear globally similar, including St. 6. The downstream group (D) shows some variability, with a clear contrast between the northern stations (29, 32) and the southern stations (12, 25, 19). The coastal stations (C) show strong variability, with St. 14 (north of Hiva Oa) again standing out from the other stations. Finally, a significant positive relationship between the geographical distance (distance from the coast) of the stations and their dissimilarity from Bray-Curtis is observed (Mantel statistic = 0.26, p-value < 0.05).
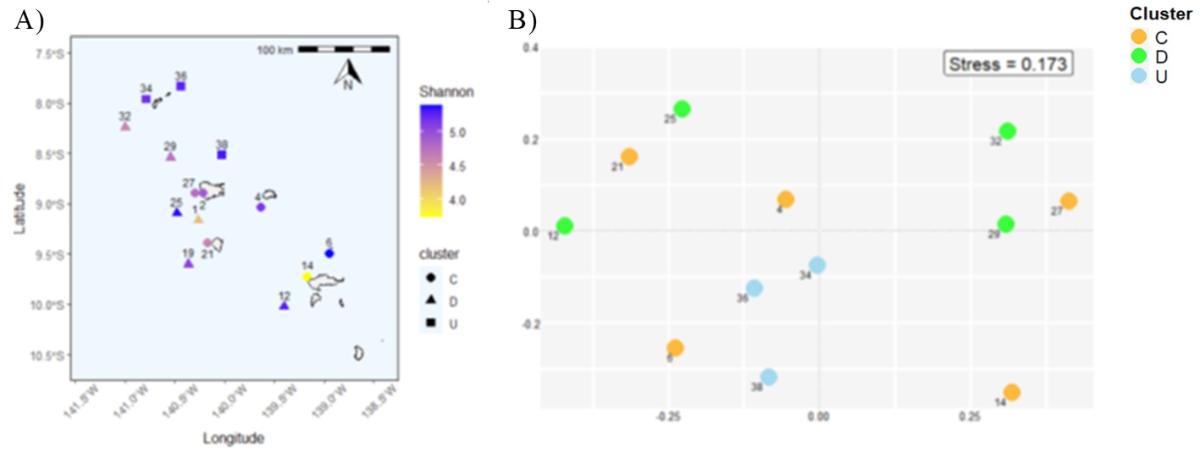
Figure 11. A) Shannon index distribution; B) NMDS analysis using Bray-Curtis dissimilarity calculated from the relative number of "reads" per sample (D= dowstream, C=coastal; U=upstream). Metabarcoding data.
Data collected at the surface were compared with those obtained in the DCM, focusing on species common to both levels (Fig. 12). This shows that the number of reads is higher on the surface. The absence of significant correlation between ASV ranks at the surface and in the DCM highlights differences in community structure between these two layers (same result with microscopy counts). For example, at station St. 14, there is a strong dominance of Thalassiosira tenera at the surface (resulting in low diversity, Fig. 11) and of the benthic diatom Cylindrotheca closterium in the DCM. This result suggests that the surface enrichments observed in the wake of the islands are not related to passive advection of organisms by vertical mixing ("apparent bloom"; Hasegawa et al., 2009), but rather to surface fertilization processes.
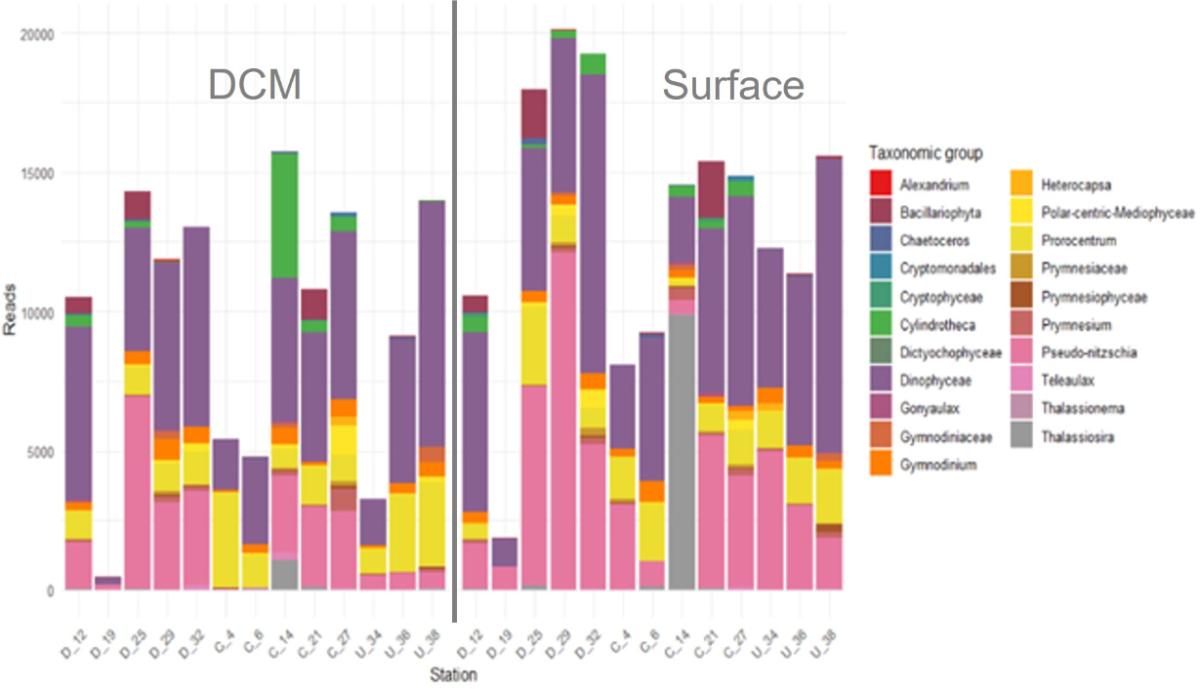
Figure 12. Main common nano- and microphytoplankton taxa (>3µm) between surface and DCM (from class to genus); metabarcoding data.
Microscopy and metagenomic data highlighted upstream/downstream and north/south differences in phytoplankton community structure. Upstream, communities appear to be relatively stable (high similarity in species richness and diversity between stations), and adapted to the mesotrophic conditions of the zone. Downstream, in the wake of the islands, specific richness decreases as biomass and production increase ; stability is destroyed, and a high degree of heterogeneity appears between stations in terms of community composition, depending on small-scale environmental conditions, distance from the coast and currentology. Near the main islands, the communities benefit from fertilization processes, before some of them are transported farther offshore, potentially triggering a second "bloom". The island mass effect (IME) of the Marquesas appears to be a constant enrichment process that spatially structures phytoplankton communities.
Large-scale satellite studies, modelling and monitoring of physical-biogeochemical floats (T. Hermilly's thesis), combined with studies of macro- and micronutrients and phyto- and zooplankton communities (C and N stocks and fluxes), will be essential for go further in the study of the structure and functioning of the pelagic ecosystem around the Marquesas and the IME.
Acoustic data and micronecton distribution (Barbin L., 2019 ; Barbin et al., 2020)
The acoustic densities obtained at 38 kHz allow to study the abundance and distribution of micronecton. Sv (densities per unit volume) is an indicator of the density of organisms, while NASC (densities per unit area) is an indicator of the biomass. Acoustic densities (Sv) in summer during MOANA-MATY 2019 show a strong latitudinal gradient between Tahiti and the Marquesas, with high values in the area near the Marquesas Islands (HNLC zone) and minima in the oligotrophic zone between the Marquesas and Tahiti (Fig. 13). Vertical migrations of micronecton are evident throughout the data, with the presence of two scattering layers with high acoustic densities or DSL (Deep Scattering Layer) between 0-200 m and 400-600 m, and a deepening of the DSL in the oligotrophic zone. These results are comparable to those observed in the austral winter (MOANA-MATY 2018), indicating a relative seasonal stability in the regional distribution of micronecton, both in the difference between the oligotrophic zone and the HNLC zone, and in the depth of the scattering layers.
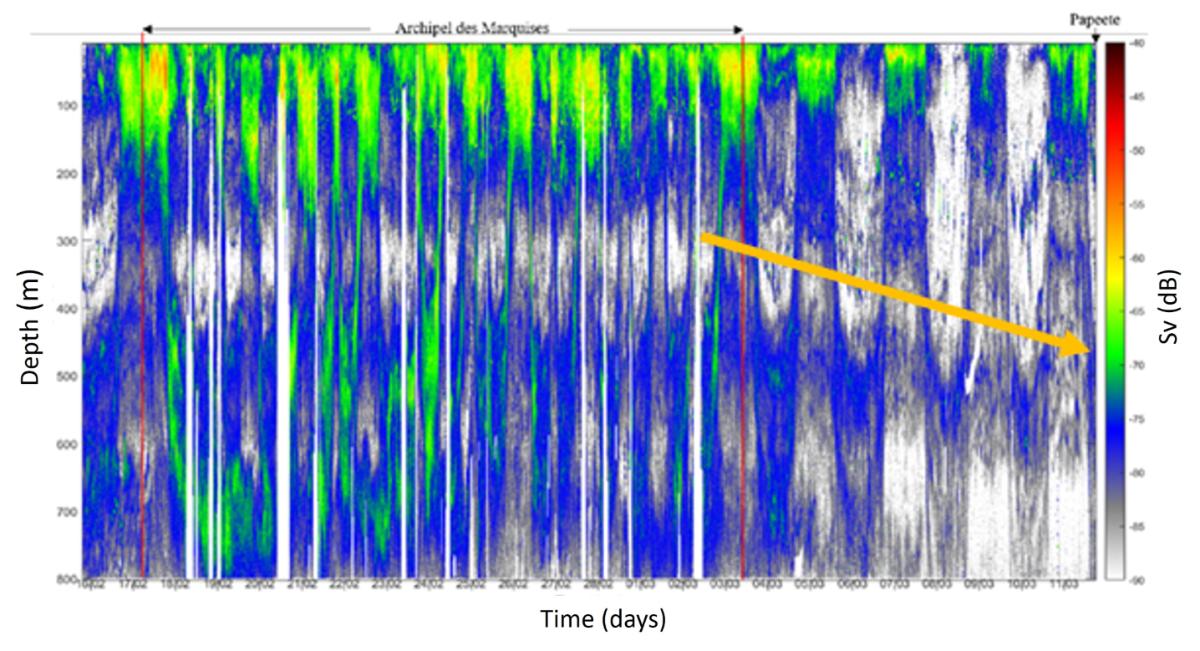
Figure 13. Time series of acoustic densities à 38kHz (Sv) during MOANA-MATY 2019, around the Marquesas archipelago and on return transect to Tahiti.
Around the Marquesas archipelago, the acoustic densities (NASC) are on average higher in the lee of the islands (SW, downstream), reflecting the marked influence of the SEC flowing westward on the spatial distribution of organisms (Fig. 14). These results contrast with the winter situation in 2018, where acoustic densities were evenly distributed around the archipelago in relation to a more "disturbed" current regime. However, surface current data alone do not explain the distribution of micronecton around the archipelago and through the water column.

Figure 14. Vertical profiles of average NASC at 38 kHz within the archipelago, following an "upstream/downstream" plan (N/E vs. S/O) of the islands, defined by the red line
The most important environmental variables in the vertical structuring of micronecton in the South Pacific are dissolved oxygen levels and the depth of the euphotic zone (Receveur et al., 2019). At the scale of the Marquesas, the comparison between NASC and the environmental parameters obtained during MOANA-MATY 2019, as well as in 2018, shows that oxygen is indeed the hydrological parameter that significantly impacts the vertical distribution of micronecton, with NASC minima occurring in the oxygen minimum zone between 300-400 m (the organisms avoid the hypoxic zone). In contrast, salinity and chlorophyll-a have a little influence on micronecton distribution, and it was not possible to demonstrate links with primary production and temperature.
Understanding the relationships between micronecton distribution and environmental variables will require improvements in physical and biogeochemical modeling tools and the use of advanced statistical methods for classifying CTD and acoustic profiles.
List of Master's students (M1) and engineering schools that have used data from MOANA-MATY 2 (M2 and thesis, see section « Bibliography »)
- Joséphine Charavit (2019) Distribution spatiale de la Chlorophylle a et structure de taille du phytoplancton dans l'archipel des Marquises à deux saisons contrastées (campagnes océanographiques Moana-Maty 1 et 2. M1 Biologie Ecologie et Evolution, Aix-Marseille Université (encadrant M. Rodier - EIO)
- Jerome Castant (2020). Evaluation de la variabilité des masses d'eau dans l'archipel à partir des données des flotteurs Argo durant la période 2018-2019. M1 Université du littoral (encadrants C. Maes, E. Martinez - LOPS)
- Claire Le Roux (2020). Current climatology derived from Lagrangian drifters in the region of The Marquesas Islands. Ecole d'ingénieur Ecole centrale Lyon (encadrants C.Maes, G. Charria - LOPS)
- Claire Layec (2024). Influence of the island mass effect of the Marquesas on protist diversity. M1 Master Sciences de la mer et du littoral - Biologie, Communautés & Ecosystèmes, UBO (encadrant M. Sourisseau - IFREMER)
References :
Barbin L., Habasque J., Martinez E., Rodier M. (2020). Acoustic data from MOANA MATY surveys. SEANOE. doi.org/10.17882/75317
Claustre, H., Sciandra, A., & Vaulot, D. (2008). Introduction to the special section bio-optical and biogeochemical conditions in the South East Pacific in late 2004: the BIOSOPE program. Biogeosciences, 5(3), 679-691.
Gove, J. M., McManus, M. A., Neuheimer, A. B., Polovina, J. J., Drazen, J. C., Smith, C. R., ... & Williams, G. J. (2016). Near-island biological hotspots in barren ocean basins. Nature communications, 7(1), 10581
Hasegawa, D., Lewis, M. R., & Gangopadhyay, A. (2009). How islands cause phytoplankton to bloom in their wakes. Geophysical Research Letters, 36, L20605. doi.org/10.1029/2009GL039743
Martinez, E., Rodier, M., & Maamaatuaiahutapu, K. (2016). Environnement océanique des Marquises. Biodiversité Terrestre et Marine des îles Marquises, Polynésie Française; Galzin, R., Duron, S.-D., Meyer, J.-Y., Eds, 123-136
Martinez, E., Rodier, M., Pagano, M., & Sauzede, R. (2020). Plankton spatial variability within the Marquesas archipelago, South Pacific. Journal of Marine Systems, 212, 103432.19
Rodier M. (2018) MOANA-MATY 2018 cruise, RV Alis, https://doi.org/10.17600/18000580
Signorini, S. R., McClain, C. R., & Dandonneau, Y. (1999). Mixing and phytoplankton bloom in the wake of the Marquesas Islands. Geophysical Research Letters, 26(20), 3121¿3124. doi.org/10.1029/1999GL010470
Torok, P., T-Krasznai, E., B-Beres, V., Bacsi, I., Borics, G., & Tothmeresz, B. (2016). Functional diversity supports the biomass-diversity humped-back relationship in phytoplankton assemblages. Functional Ecology, 30(9), 1593¿1602. doi.org/10.1111/1365-2435.12631
Receveur, A. (2019). Ecologie spatiale du micronecton: distribution, diversité et importance dans la structuration de l'écosystème pélagique du Pacifique sud-ouest (Doctoral dissertation, Aix-Marseill