- Hydrodynamics and particle drift: drifting buoys SVPs versus GEKCO product (Cassianides et al., 2020; research training of Cassianides A., 2019; Le Roux C., 2020; Castant J., 2020)
15 surface drifting buoys (SVPs) were deployed during MOANA-MATY 1 (Fig. 3), which, in addition to providing the meteorological authorities with atmospheric observations, made it possible to assess the relevance of the GEKCO (Geostrophic and Ekman Current Observatory) surface current product derived from satellite observations. These current fields are the sum of the geostrophic component (derived from sea surface height elevation) and the Ekman component (derived from wind stress).
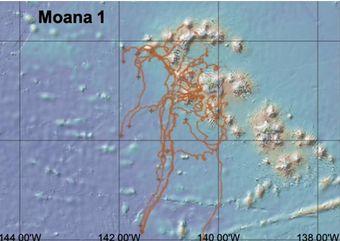
Fig. 3 Trajectories of surface drifters 15 days after the campaign
Lagrangian simulations were carried out, releasing particles into the GECKO current fields north of the archipelago where the SVPs were deployed every day from October 1 to 10, 2018 (Fig. 4). Their trajectories were calculated for 3 months and then compared with those of the SVPs deployed during the mission. The dispersion of the simulated particles is more consistent with that of the SVPs when the wind component is divided by 2, indicating an overestimation of the Ekman component in GEKCO and suggesting the use of a 50% corrected product of this component.
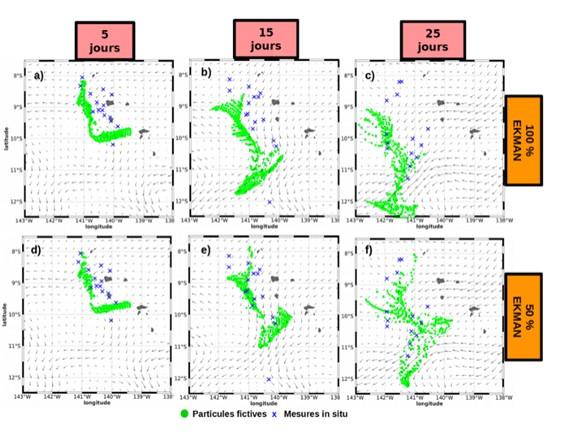
Fig. 4: Comparison of the dispersion of surface drifters deployed during MOANA-MATY 1 (blue crosses) with that of fictitious particles (green circles).
In addition to data from drifting buoys, measurements from the S-ADCP attached to the NO Alis were used to map currents during each cruise (Fig. 5).
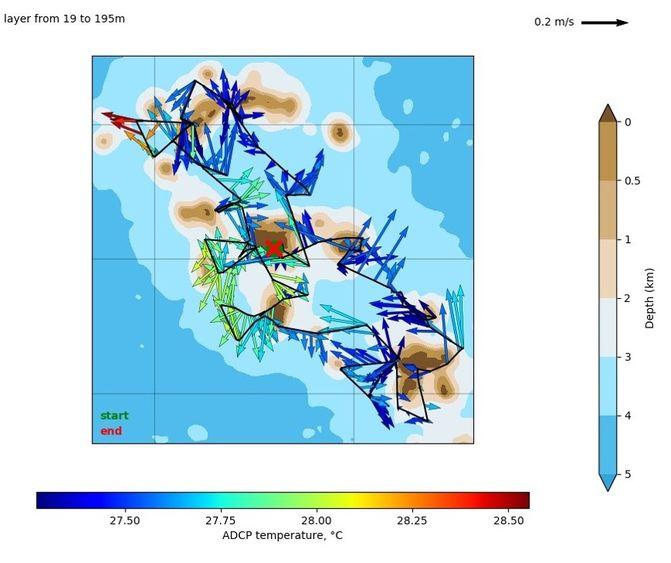
Fig. 5: Average currents in the 19-195m layer recorded during the MOANA-MATY1 cruise.
- Iron distribution (Grand M., workshop dec. 2022)
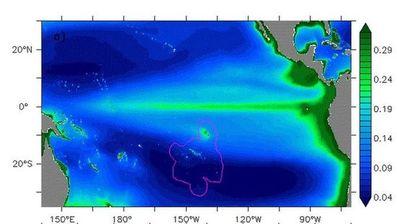
Iron bioavailability is a limiting factor in phytoplankton production in many oceanic regions, and one of the aims of the MOANA-MATY 1 campaign was to measure this bioavailability in the Marquesas zone and test the hypothesis of iron limitation in this "High nutrient" region ((NOx + NH4 = 4.21 ± 1.3 µmol L-1; PO4 = 0.48 ± 0.07 µmol L-1; Si(OH)4 = 2.0 ± 0.3 µmol L-1; mean values during the campaign). We therefore sampled 13 stations for Fe, targeting five distinct depths within the upper 90 meter using a Teflon bellows pump and a 100 m acid-cleaned hose. To further our understanding of freshwater Fe contributions, we also collected surface samples from Waituha Bay (Eiao) and stream samples from Eiao and Ua Pou. The samples were then analyzed for dissolved Fe (dFe: filtered samples) and total dissolvable Fe (TDFe: unfiltered samples) at the Moss Landing Marine Laboratories using a luminol chemiluminescence Flow Injection Analysis system, modified from Obata et al. (1993). The method showcased a limit of detection at 0.02 nM, with an analytical precision of < 5% for [dFe] > 0.15 nM and 5-15% for lower concentrations. Analytical accuracy was validated through the analysis of SAFe and GEOTRACES reference samples, achieving recoveries exceeding 95% for both D1 (n=18) and GSC (n=4).
The mean surface dFe during MOANA-MATY 1 was 0.12 ± 0.05 nM, in agreement with prior studies such as Blain et al. (2008). While much of the study area exhibited consistent low surface dFe concentrations (approximately 0.15 nM), two specific stations, located northwest of Nuku Hiva (orange triangle) and on the western side of Ua Pou (green cross), displayed elevated concentrations up to 0.25 nM (Fig. 6). These elevated concentrations persisted throughout the upper 90 meters at these stations.
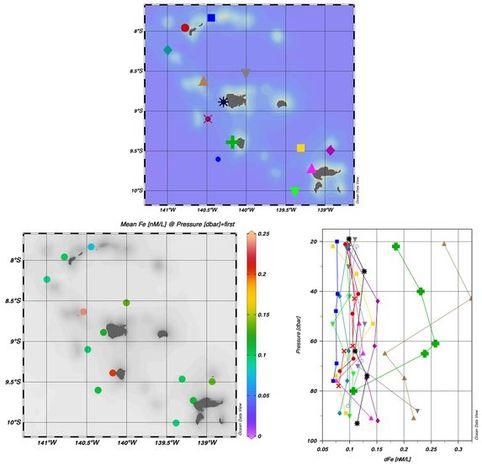
Fig. 6. Dissolved Fe during MOANA-MATY 1. Bottom left: mean surface dFe, Bottom right: vertical dFe profiles
The TDFe data, encompassing both dFe and labile Fe linked with biogenic and lithogenic particles, highlighted increased values on the western peripheries of all islands (Fig. 7). This suggests a potential, albeit localized, Fe contribution from the islands' sediments. Stream water samples from Eaio and Ua Pou showed Fe concentrations of 82 nM and 280 nM, respectively. The variance in concentrations might be attributed to differing lithologies. In collaboration with Helene Planquette (LEMAR), these insights will be integrated with the particulate trace metal data to elucidate the potential influence of island sediments in supplying bioavailable Fe.
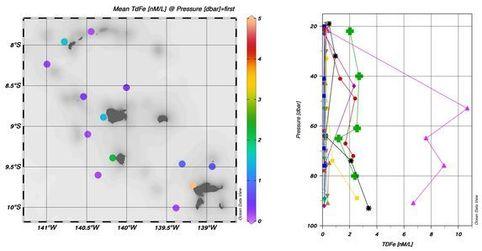
Fig. 7. Total Dissolvable Fe (TDFe) during MOANA-MATY 1. Bottom left: mean surface TDFe, Bottom right: vertical TDFe profiles.
- Hydrodynamic activity and phytoplankton distribution: in situ and satellite data (Cassianides et al., 2020; Hermilly T.'s thesis 2022-2025; research training of Charavit J. 2019; Matitia, 2019)
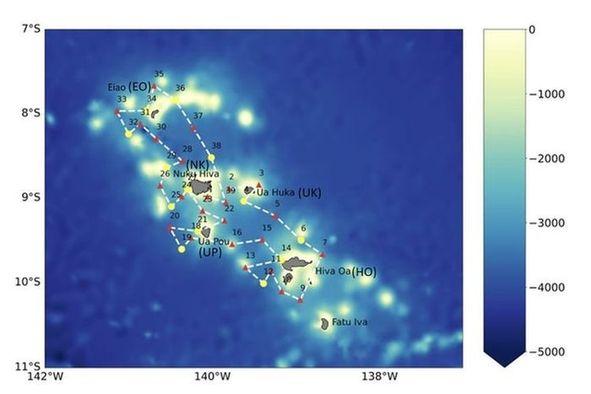
Two remarkable phytoplankton blooms were observed from GlobColor-GSM satellite images during and just after the campaign, and were studied by combining satellite observations and in-situ data from the MOANA-MATY 1 campaign. For example (Fig. 8), surface current observations combined with a Lagrangian approach illustrate that the particles observed at the level of the chlorophyll plume (Chla) on October 3, 2018 in the south of the archipelago passed in direct proximity to the islands (95% of cases), indicating that the islands are at the very origin of the biological enrichments observed. Mesoscale circulation then modifies the distribution of the Chla plume over several hundred kilometers downstream of the islands.
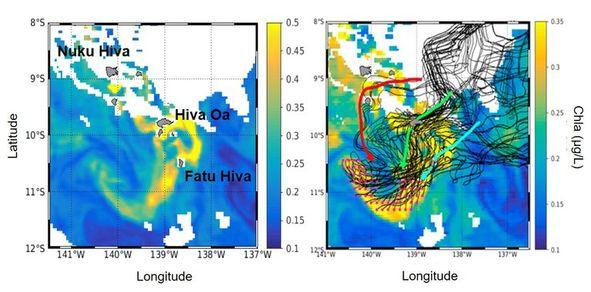
Fig. 8. Left: Chla distribution (µg L-1) derived from GlobColor-GSM ocean color images on Oct. 3, 2018. Right: Chl and particle drift trajectories (black line) derived from backward Lagrangian analysis from their initial positions (magenta dots). The three arrows indicate the preferential paths taken by the particles, around Ua Huka, Nuku Hiva and Ua Pou (red), Hiva Oa (green), Fatu Hiva (blue).
In agreement with satellite data, in situ Chla distribution (Fig. 9) showed that the highest enrichments occurred near the islands in the surface layer (0.80 to 0.90 mg Chla L-1) and mostly downwind of the islands, indicating favorable environmental conditions for phytoplankton development (macro- and micronutrient inputs, stability of the water column, etc ...). However, due to the strong mesoscale dynamic activity observed in austral winter, which can modulate the plumes (Fig. 8), the contrast between Chla values upwind and downwind of the islands was not very pronounced. Outside the rich zones, Chla was distributed deeper with a maximum (DCM) between 60-100m.
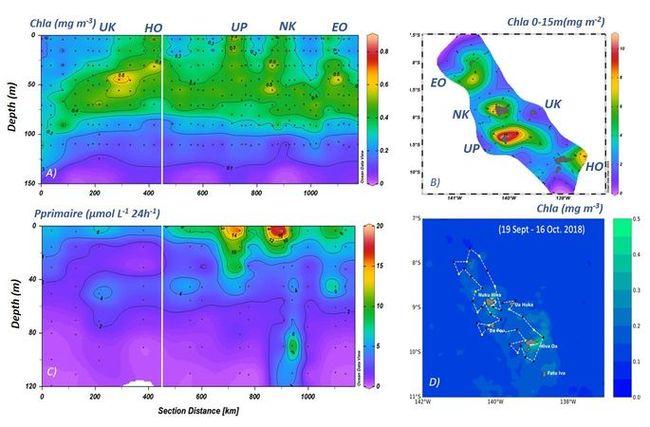
Fig. 9. Chla distribution and primary production in austral winter during the MOANA-MATY 1 cruise. A) Total Chla by HPLC, B) Chla integrated 0-15m C) Primary production. D) Surface Chla derived from GlobColor satellite images. The white line indicates the area windward of the islands (left) and leeward of the islands (right).
Integrated Chla values on the euphotic layer (0.1% light) ranged from 10.4 to 52.2 mg Chla m-2 (30.8 ± 9.2 mg Chla m-2). These biomass values are associated with high primary production values ranging from 144 to 682 mgC m-2 d-1 (320 ± 184 mgC m-2 d-1) with maximum values at the surface (0-20/30m) and near Ua Pou (Fig. 9). These biomass and production values reflect a mesotrophic (HNLC-type) system when compared with equatorial upwelling data between 140°W and 110°W of the order of 26.5 ± 3.5 mg Chla m-2 and 748 ± 110 mg C m-2 d-1, respectively (Balch et al., 2011). The pelagic ecosystem around the Marquesas archipelago thus appears to be a globally productive system, but subject to strong variability on a smaller scale of time and space, linked in large part to strong and complex oceanic dynamic activity.
Chlorophyll biomass was largely dominated by picoplankton (Chla < 2µm representing 75 to 95% of total Chla ) as in the equatorial upwelling (Blach et al., 2011), and in agreement with previous observations in the same area (Martinez et al. 2012). Pigment data (HPLC) also showed a predominance of picocyanobacteria (40-60% of total Chla), largely dominated by Synechococcus near surface islands with abundances that can exceed 80 ×103 cells mL-1, while Prochloroccoccus dominate elsewhere (flow cytometry data). Observations using inverted microscopy have also enabled us to draw up an initial taxonomic inventory of nano- and microphytoplankton, as well as highlighting changes in communities within the archipelago, coupled with high variability in abundance (Fig. 10). Flagellates dominated with two main groups: Prymnesiophytes (16 species, mainly Coccolithophores) and Dinoflagellates (81 species). Diatoms (65 species) are most abundant downstream of the islands, with a maximum near Ua Pou. These microscopy, pigment and flow cytometry data will be supplemented/confirmed by meta-barcoding DNA measurements during the second MOANA-MATY 2 mission.
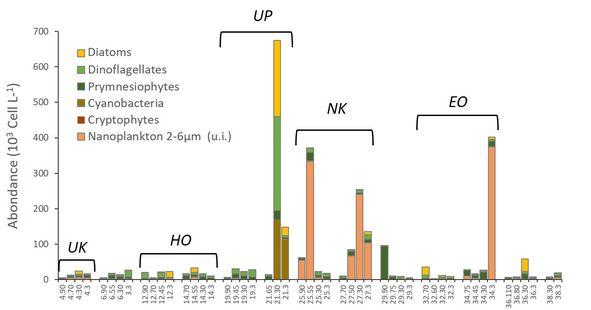
Fig. 10. Nano and microphytoplankton community composition in austral winter during MOANA-MATY 1 (inverted microscope observations). X-axis = #station-depth (in m). Ua Huka (UK) , Hiva Oa (HO), Ua Pou (UP), Nukku Hiva (NK), Eiao (EO).
The phytoplankton data set raises the questions of 1) how much of the Chla (and nutrients) observed in the plumes is directly advected from the islands, and how much is potentially induced by the dynamics of eddies or front zones; and 2) how the structure of phytoplankton communities will structure the overall food web. Large-scale satellite studies, modelling and the monitoring of physical-biogeochemical floats (T. Hermilly's thesis, 2022-2025) combined with the study of macro- and micronutrients and phyto- and zooplankton communities (stocks and C, N fluxes), will be essential to understand the origin of enrichments and go further in the study of the functioning of the pelagic ecosystem around the Marquesas.
- Acoustic measurements and distribution of micronekton (Barbin et al., 2020; research training of Barbin L., 2020)
Acoustic densities acquired by recording at 38kHz allow us to study the abundance and distribution of micronekton. These data showed a strong latitudinal gradient between Tahiti and the Marquesas, with high values in the HNLC zone near the Marquesas Islands and minima in the oligotrophic zone during transits to and from Tahiti (Fig. 11). The vertical migrations of micronektonic organisms were visible in all the data, with the presence of two deep scattering layers (DSL) between 0-200m and 400-600m.
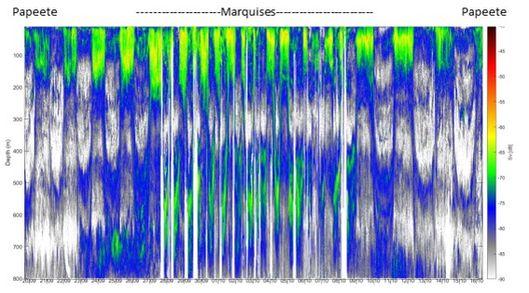
Fig. 11: Acoustic intensity per unit volume (volume backscattering coefficient, Sv in dB) at 38 kHz as a function of time during MOANA-MATY 1. The dotted lines delimit the Marquesas archipelago zone.
In the Marquesas, acoustic data per unit area (NASC, nautical area scattering coefficient; Fig. 12) were evenly distributed around the archipelago day and night, showing no significant differences between upwind ("upstream") and downwind ("downstream") areas,
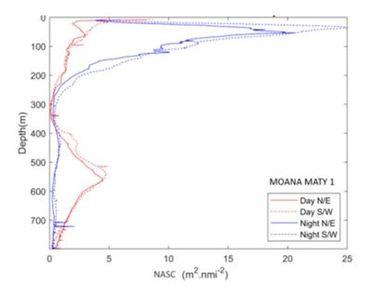
Fig. 12. 38kHz vertical profiles of average NASC in the archipelago, following an "upstream/downstream" plane of the islands (N/E vs. S/W). Night (blue) and day (red) profiles.
The most important environmental variables in the vertical structuring of micronekton in the South Pacific are the amount of dissolved oxygen and the depth of the euphotic zone (Receveur et al., 2019). A comparison between SINC and environmental parameters at the archipelago scale suggested that oxygen was the hydrological parameter that most impacts the vertical distribution of micronekton. Conversely, ocean dynamics in the archipelago appeared to play a minor role. However, the results underlined the complexity of micronekton distribution around the islands, and the difficulty of establishing direct links between its distribution and environmental parameters.
List of L3, M1 and engineer research training using MOANA-MATY 1 data (M2 and thesis see the section "References")
Charavit Joséphine (2019) Distribution spatiale de la Chlorophylle a et structure de taille du phytoplancton dans l'archipel des Marquises à deux saisons contrastées (campagnes océanographiques Moana-Maty 1 et 2. M1 Biologie Ecologie et Evolution, Aix-Marseille Université (encadrante M. Rodier - EIO)
Matitia Tanya (2019). Effet d'iles aux Marquises : étude de la variabilité spatiale et saisonnière des paramètres physiques et biogéochimiques dans l'archipel. 3rd yr of Bachelor, Université Montréal, Canada (encadrantes M. Rodier - EIO & E. Martinez - LOPS)
Castant Jerome (2020). Evaluation de la variabilité des masses d'eau dans l'archipel à partir des données des flotteurs Argo durant la période 2018-2019. M1 Université du littoral (encadrants C. Maes & E. Martinez - LOPS)
Le Roux Claire (2020). Current climatology derived from Lagrangian drifters in the region of The Marquesas Islands. Ecole d'ingénieur Ecole centrale Lyon (encadrants C.Maes & G. Charria - LOPS)
Cited references
Balch, W. M., Poulton, A. J., Drapeau, D. T., Bowler, B. C., Windecker, L. A., & Booth, E. S. (2011). Zonal and meridional patterns of phytoplankton biomass and carbon fixation in the Equatorial Pacific Ocean, between 110 W and 140 W. Deep Sea Research Part II: Topical Studies in Oceanography, 58(3-4), 400-416
Blain, S.; Bonnet, S.; Guieu, C. (2008) Dissolved iron distribution in the tropical and sub tropical South Eastern Pacific. Biogeosciences, 5, 269¿280.
Blanke, B.; Raynaud, S. (1997) Kinematics of the Pacific Equatorial Undercurrent: An Eulerian and Lagrangian Approach from GCM Results. Journal of Physical Oceanography, 27(6), 1038-1053.
Claustre, H.; Sciandra, A.; Vaulot, D. (2008) Introduction to the special section bio-optical and biogeochemical conditions in the South East Pacific in late 2004: The BIOSOPE program. Biogeosciences, 5, 679¿691.
Martinez E., Rodier M., Maamaatuaiahutapu K. (2016) Environnement océanique des Marquises. In Galzin R., Duron S.-D. & Meyer J.-Y. (eds), Biodiversité terrestre et marine des îles Marquises, Polynésie française. Société Française d'Ichtyologie, Paris : 123-136.
Martinez, E., Raapoto, H., Maes, C., Maamaatuaihutapu, K. (2018) Influence of Tropical Instability Waves on Phytoplankton Biomass near the Marquesas Islands. Remote Sensing, 10(4), 640.
Martinez E., Rodier M., Pagano, M., Sauzède R. (2020) Plankton spatial variability within the Marquesas archipelago, South Pacific. Journal of Marine Systems, 212, 103432
Obata, H., Karatani, H., Nakayama, E. (1993). Automated determination of iron in seawater by chelating resin concentration and chemiluminescence detection. Analytical Chemistry, 65(11), 1524-1528.
Receveur, A. (2019). Ecologie spatiale du micronecton: distribution, diversité et importance dans la structuration de l'écosystème pélagique du Pacifique sud-ouest (Doctoral dissertation, Aix-Marseille).