UCTD
Continuation of UCTD tests (following training received at ESSLOPS leg1)
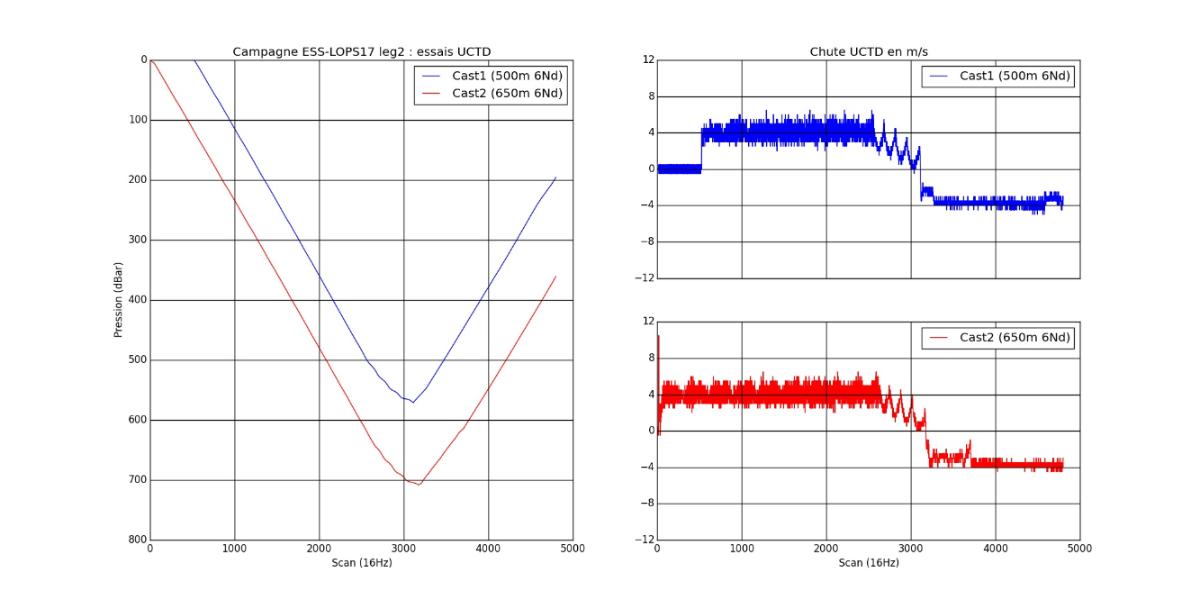
Microriyo
Sea trials of the MicroRiYo vehicle (MR below) took place over two days on 31/10 and 1/11/2017. The work took place in zonex 6 on the first day (4 MR profiles and two VMP profiles), and in zonex 4 on the second day (one MR profile and two VMP profiles).
As the Europe R/V was not equipped with a hull ADCP, the mean horizontal current over the first 500 metres is estimated from the drift of the VMP between its deployment and recovery points. On the first day in zonex 6, the current was fairly strong, averaging around 20 cm/s over 500 m; on the second day, in zonex 4, it was much weaker, less than 5 cm/s. The advantage of this configuration was that the first day could be used to test whether the vehicle did not get stuck on the line due to increased friction caused by horizontal currents transverse to the vehicle descent. We could also test whether the signal-to-noise ratio of the shear probes was not too degraded in the presence of such a current. The second day with weak currents enabled us to test the noise level of the mesurements.
Several tests initially planned for Leg-1 were carried out to compare downcast velocities in different configurations and to determine the quality of the dissipation rate data compared with the VMP-6000 reference data.
a) Falling speed
The speeds obtained at sea were 10 to 20% lower than found during the pre-cruise test in the pool for an 800 g ballast. They were still fairly close to what can be expected assuming a drag coefficient (Cx) of 0.1 (after a rough estimate based on measurements in the pool). The test with a 400 g ballast (MR#3) was inconclusive: the MR often got stuck and descended intermittently. For all the MicroRiYo profiles, the fall speeds were irregular and generally weak in the first 50 to 100 m with the 800 g and 1200 g weights (w < 0.3 m/s for z < 50-100 m).
The lower speeds at sea compared with those of the pool basin may be due to the increased friction on the line induced by the presence of horizontal currents (in particular the fact that the fall speed is irregular and low below 50-100 m). The difference in density between the pool seawater and the Mediterranean waters also contributed, with a relative MR buoyancy that was 120 g larger in the Mediterranean; this may also explain much of the difference in speed when testing with 800 g weights. Finally, the presence of the daggerboard (profile #5) clearly decreased the downcast velocity because it added buoyancy (~170 g) and drag (half of the slowdown is due to these two causes, according to a rough estimate).
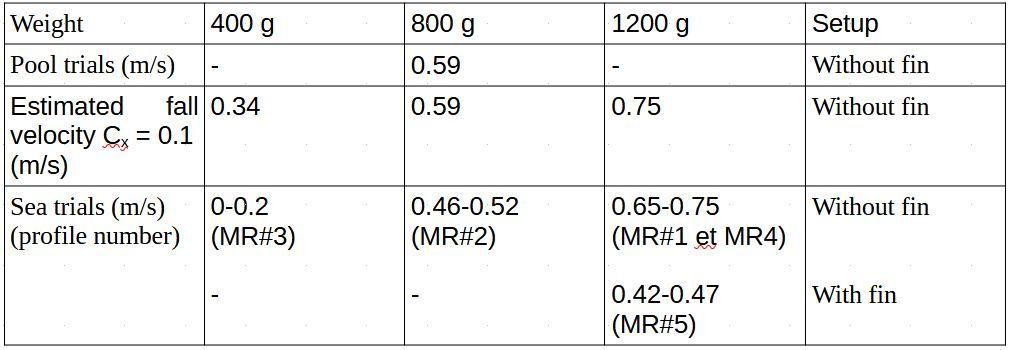
Table 1: Fall speed of the MicroRiyo vehicle as a function of the mass of the weights added to the vehicle. Line 1: speed measured in the pool, line 2: estimated speed based on a drag coefficient Cx of 0.1, line 3: speed measured at sea.
b) Vibrations and energy dissipation
The other aim of these MR sea trials was to determine whether the friction of the MR on the line did not induce too many spurious vibrations on the measurements of velocity shear and therefore of kinetic energy dissipation. A comparison of the dissipation profiles of the VMP and the MR showed encouraging results.
Figure 1 illustrates the variability of the downcast velocity of the second MR profile. It was only at around 120 m that the velocity got more stable around 0.45 m/s. The energy dissipation recorded during this second MR profile showed good general agreement with the VMP #2 profile below 120 m (i.e. where the fall velocity of the MR is stabilized)(Fig. 2). The difference with the VMP #1 profile was greater over certain depth ranges. The difference between the two VMP profiles illustrated the temporal variability of the dissipation rate at this location. This second MR profile was taken 3h after VMP #1 and 3h before VMP #2. The MR dissipation measurements above 120 m were not good (where MR velocity is weak and not stabilized). On some other short sections, the MR dissipation was also contaminated (150-170 dbar, 400-420 dbar, 500-510 dbar). The reason for this coould not be clearly determined. The vehicle behavior needs a closer analysis to understand what was happening in these small regions.
In zonex 4, on the second day, ocean dynamics was less energetic. The downcast velocity of the MR stabilized below 80 m (Fig. 3), the depth at which the dissipation of the MR profile became consistent with the VMP #4 profile (Fig. 4). Because currents were weaker (< 5 cm/s on average), turbulence was weaker and we could see that the MR dissipation signal was still consistent with that of the VMP, even when dissipation was less than 10-10 W/kg (below 300 dbar). This showed that, overall, the MR profiles were not really much noisier than those of the VMP for these cases.
Conclusion from these tests: dissipation measurements along the line in front of the ship are generally of good quality compared with the VMP-6000. These tests motivated the continuation of the project. Following this cruise, a MicroRider 6000 was acquired from LOPS and integrated into a version 2 of the vehicle.
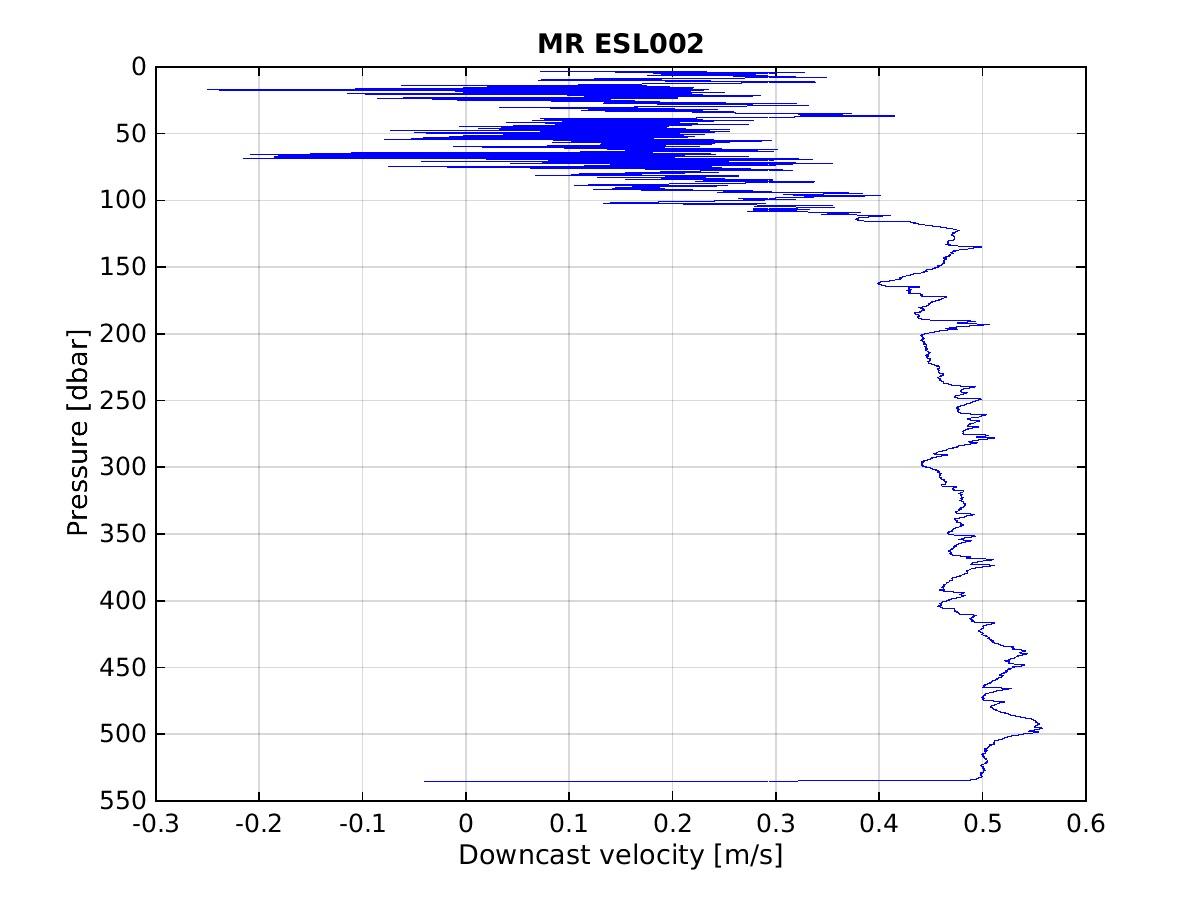
Figure 1: profile downcast velocity as a function of pressure for the second Microriyo profile (800g ballast)
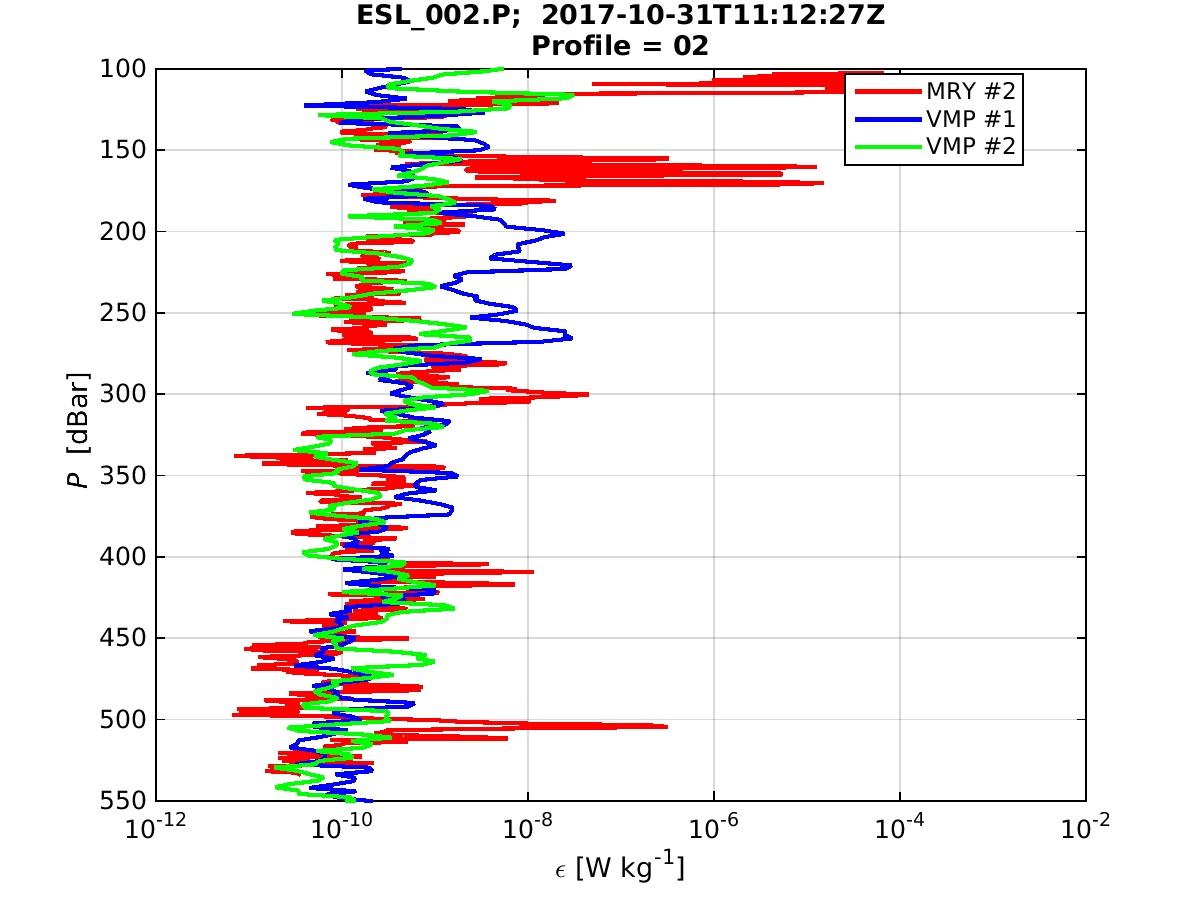
Figure 2: Kinetic energy dissipation profiles [W/kg] for the second MR profile and the first two VMP profiles
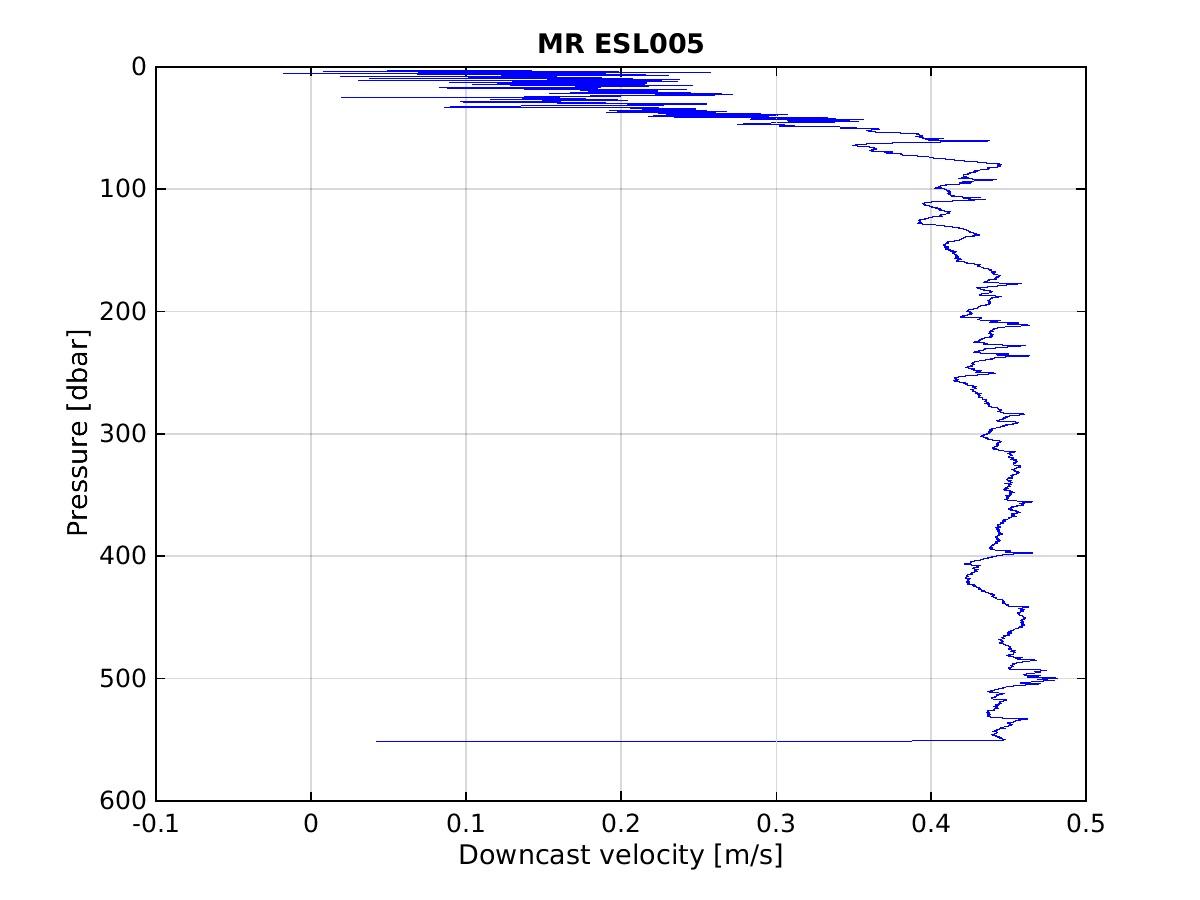
Figure 3: Profile downcast velocity as a function of pressure for the fifth Microriyo profile (1200g ballast, with spin)
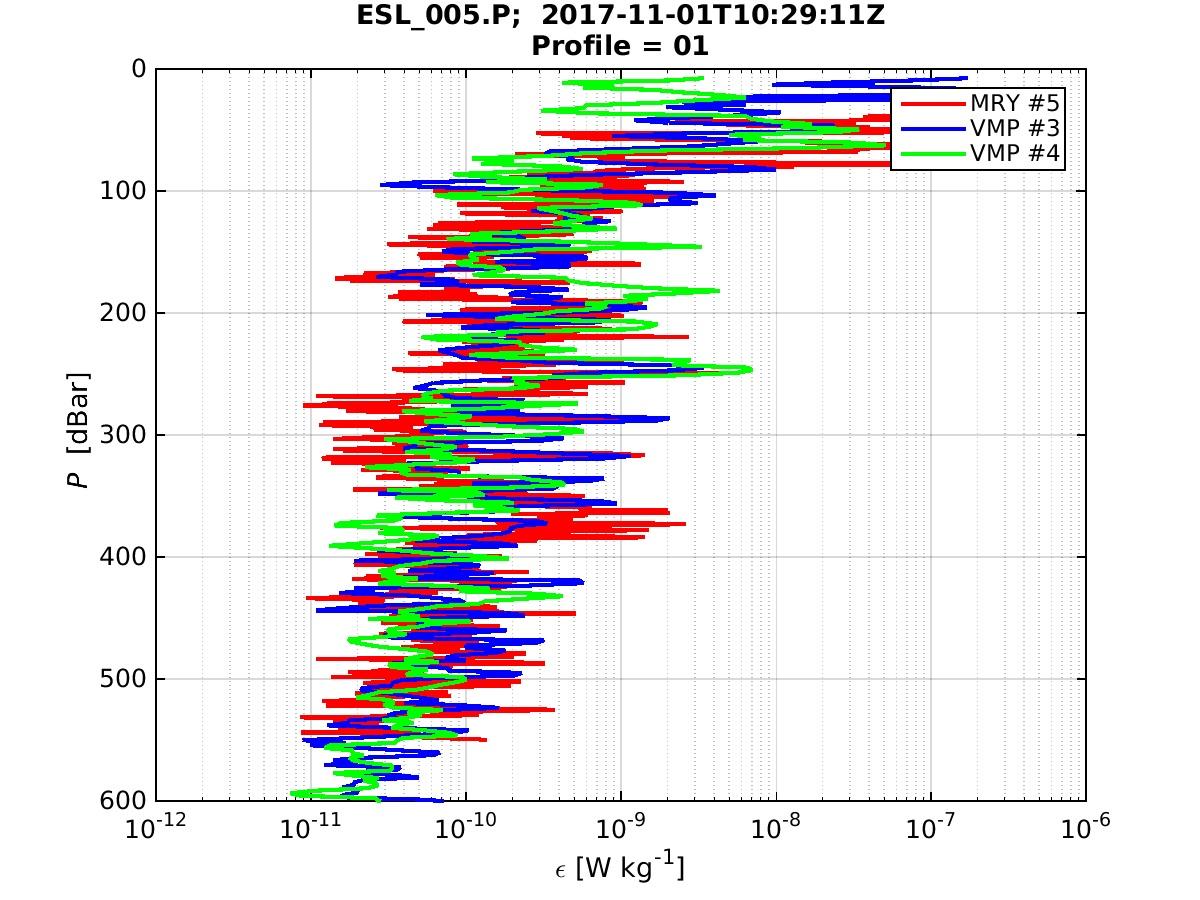
Figure 4: Kinetic energy dissipation profiles [W/kg] for the fifth MR profile and the last two VMP profiles


