Spatial distribution at the canyon scale
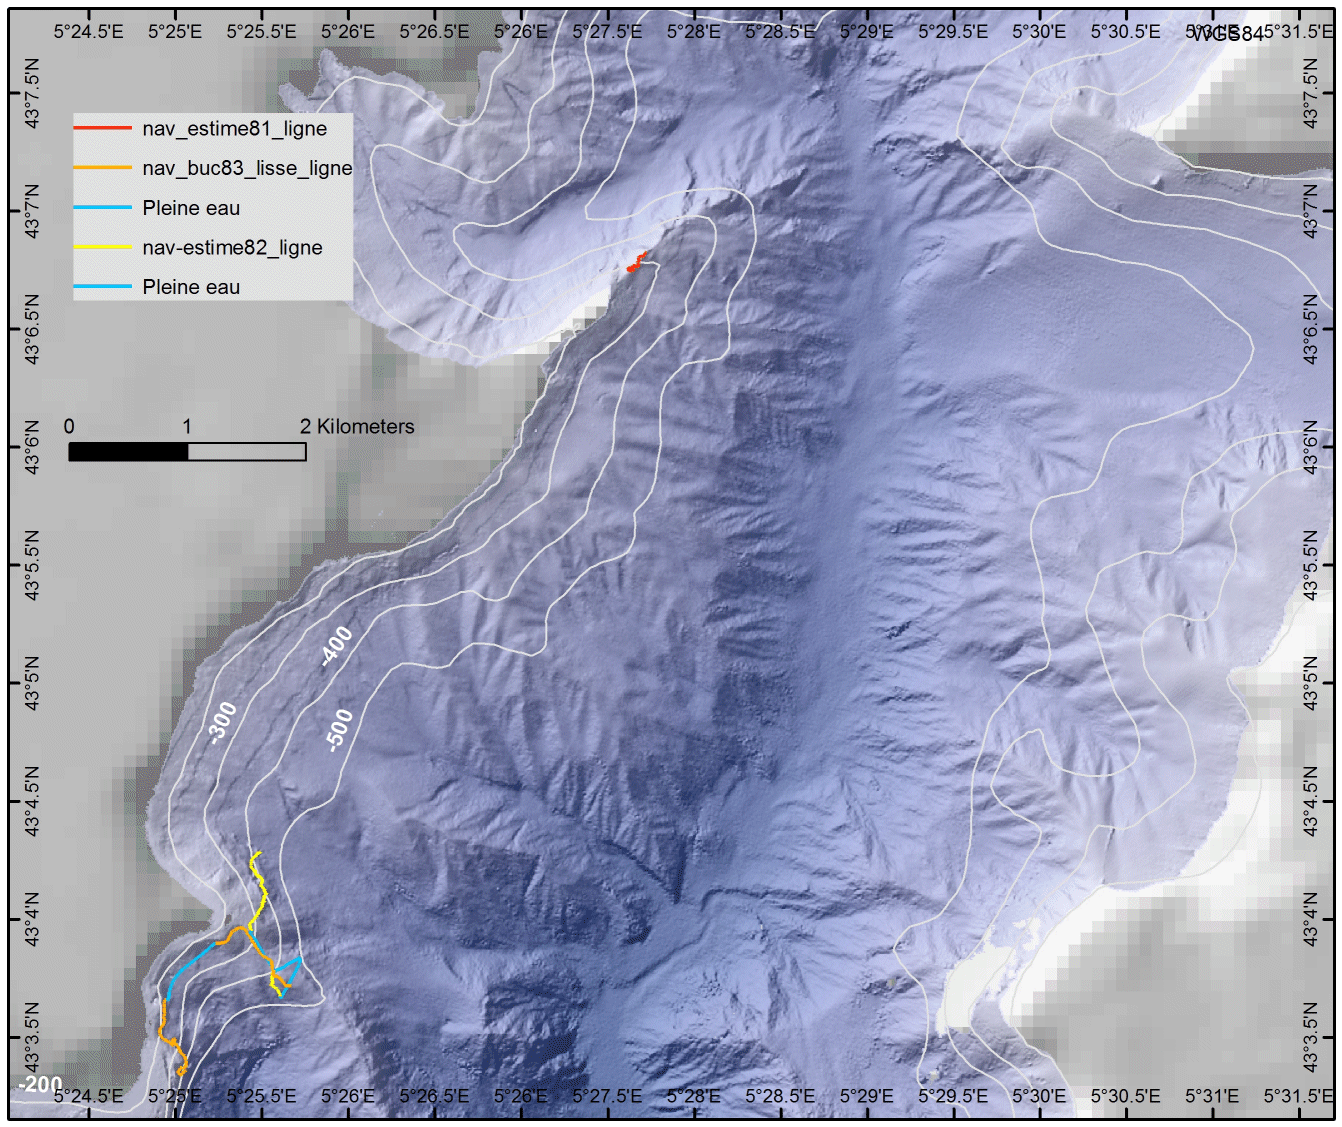
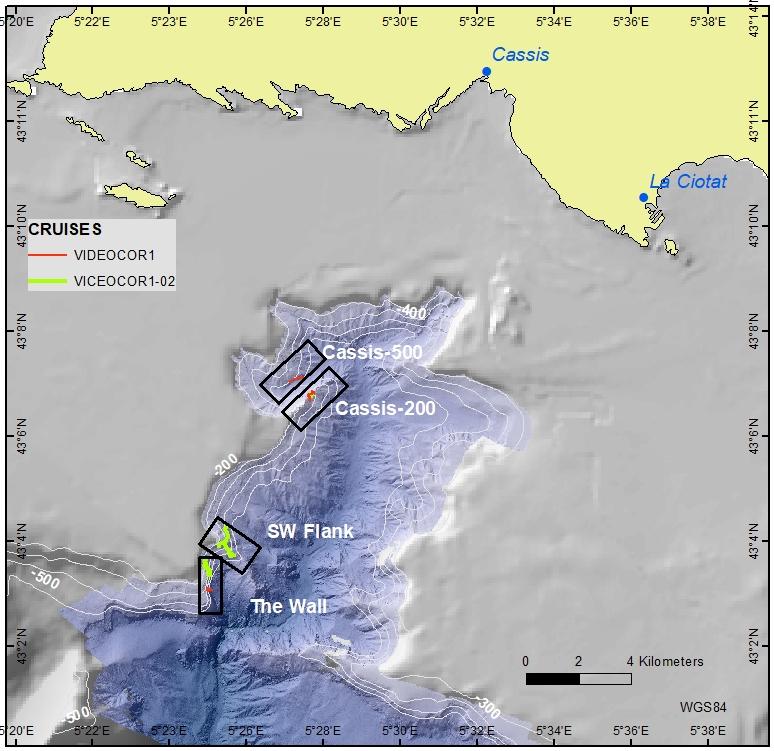
The selection of the Ariane H-ROV dive areas during the Videocor1 and Videocor1-02 cruises was based on the probable areas of presence of the target scleractinian species (Madrepora oculata). These probable areas of presence were derived from a statistical model of the probable distribution of coral habitat (Fabri et al., 2017, Bargain et al., 2018). This model was previously calculated from a dataset, presence and absence, collected during previous cruises (Fabri et al., 2014).
Dives conducted during the Videocor1 and Videocor1-02 oeanographic cruises validated and invalidated predicted areas. They also allowed us to expand our knowledge of the distribution of corals in the canyon and to discover areas of presence unknown until then (Fabri et al., 2019).
- Coral colonies present in the Cassis-200 area were exhaustively mapped on small knolls located on a ridge subject to strong currents (around 220 m depth).
- The corals present on the Cassis-500 area are located on a rocky step, which was identified thanks to the bathymetric maps of the BATHYCOR cruises (around 450 m depth).
- The corals present on The Wall site at the exit of the canyon were located under an overhang identified on the BATHYCOR survey maps (around 330 m depth)
- The SW Flank site was explored but only 3 scleractinian colonies could be observed (around 350 m depth).
Measurement of the condition of the corals (Scleractinians) Madrepora oculata
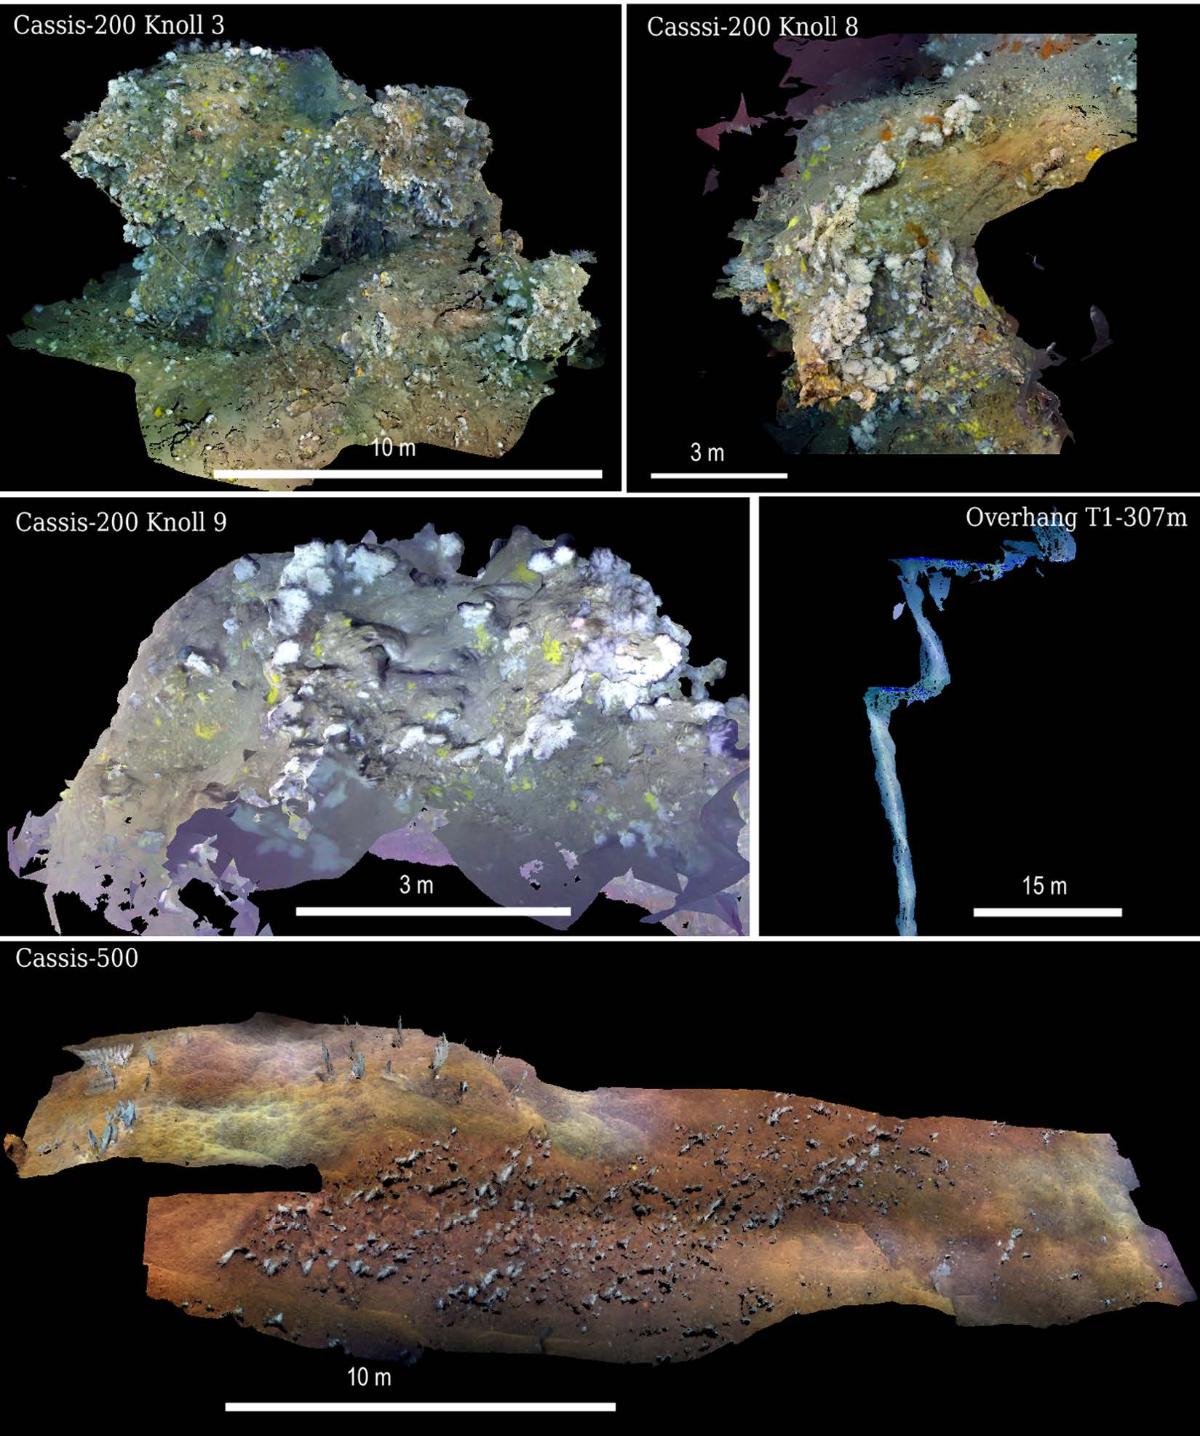
The images (digital photos and videos) from the H-ROV Ariane were used to build 3-D reconstructions (photogrammetry) of most of the coral areas encountered during the cruise (Fig. 2).

Figure 2. 3D model examples on Cassis-200, Cassis-500, and The Wall (from Fabri et al., 2019).
These 3D- reconstructions (georeferenced and scaled) allowed to measure population parameters on the whole area:
- Surface occupied by the species: 1650 m², including 25% on Cassis-200, 56% on Cassis-500 and 19% on The Wall
- Density of the colonies : Cassis-200 = 4 colonies/m² (up to 12 according to the "knoll") ; Cassis-500 = 4 colonies / m² ; The Wall = 9 colonies /m² (only small colonies).
- Size measurements of the colonies : Cassis-200 (18 +/- 12 cm ; max = 78 cm) ; Cassis-500 (12 +/- 8 cm ; max = 67 cm) ; The Wall (11 +/- 3 cm, max = 22 cm).
- Coral debris surfaces: Presence of debris (broken colonies) on the sites holding scleractinians. At Cassis-200 (22% of the cover), Cassis-500 (1 to 2%) where more debris are probably buried in the red mud, The Wall (49%) where a lot of debris were found because colonies are fixed upside down and fall under their own weight.
The images also allowed the identification of anthropogenic nuisances :
- Marine litter: 93% of the litter was plastic, including lost fishing gear (67% to 98% longlines). The highest density of waste was at the SW Flank site (10.6 items/km), followed by Cassis-200 (9.5 items/km), Cassis-500 (7.8 items/km) and finally The Wall (4.9 items/km). The lost fishing gears were old (currently fishing is regulated) but they persist in the environment. Apart from plastics we found metal and glass.
Digital photos allowed us to identify a number of species:
- The megafaunal diversity associated with these ecosystems was recorded (species list) and compared between all coral sites in the canyon : Cassis-200 (63 species) Cassis-500 (34 species) The Wall (23 species) SW Flank (52 species). A group analysis based on similarity in presence/absence of the different species showed that Cassis-200 and SW Flank were more than 70% similar (Sorensen index), The Wall was close to the two previous ones at 50% and Cassis-500 at 48% of the other three.

Figure 3. A forest of whip gorgonians (Viminella flagellum) set on the rim of a rocky shelf and sheltering a multitude of sponges as well as galatheids (Munida sp.)... (SW Flank, at 306 m, on 09/30/2017, dive 82-02).
The population parameters and the measurement of associated diversity allowed the calculation of percentages of impacted surfaces, notably by bauxite residues (56% of the coral habitat is impacted by red mud discharges, with a reduced diversity of associated fauna and 1% of the colonies smothered and dead in place on the Cassis-500 site). Lost fishing gear is ubiquitous, especially at the shallower Cassis-200 and SW Flank sites, although the corals are located in the areas of strong protection of the « Parc National des Calanques ».
Temporal Evolution
Photogrammetry provided much information on the complex locations in Cassidaigne canyon. Every site/location can now be easily recognized by its particular shape, and 3D models helped to better understandn where vulnerable ecosystems are located. Moreover, the detailed maps produced in this work will be of great help for future monitoring of the area. Also, the precise navigation now possible with ROVs and submersibles allows exact positioning and returning to study locations very easily, ensuring repeatability in the methodology.
In a world in which the number of impacts on marine environments is increasing, and in which assessments sometimes use methodologies like sampling that damage marine ecosystems, innovative non-intrusive methods such as imagery and 3D models can be used to better understand protected habitats. Photogrammetry is therefore a good means of obtaining quantitative data in the deep sea and of better calculating surfaces, densities and size parameters.
This methodology allows comparing quantitative data between sites and monitoring their evolution through time. 3D models built at regular intervals will allow monitoring vulnerable ecosystems, giving access to distribution, density and size parameters.
Some small mounts (knolls) in the Cassis-200 area explored in 2017 had been previously photographed and could be compared. New colonies appeared in some places (Fig. 4).

Figure 4: Illustration of the temporal evolution at Cassis-200. Knoll3: Photos and reconstructions at 7 years interval, the red arrow indicates the location where new colonies appeared. Knoll 9: Photos reconstructions 5 years apart, yellow arrow indicates location where colonies appear to have grown (from Fabri et al., 2019).
This work on population status was the subject of Beatriz Vinha's Master 2 internship (Vinha, B., 2018). Georeferenced data with the positioning of all structuring species are available in Sextant (see published data). These data have been used for MSFD (Marine Strategy Framework Directive) reporting, of which the measurement of abrasion impacts (Menot et al., 2021). These data are currently used for reporting on the status of ecosystems under the MSFD, descriptor D1-D6 Deep Benthic Habitats (in progress; D1 Biodiversity; D6 Bottom Integrity), as well as under the Habitats Fauna Flora Directive.
Outreach
The images from the Videocor1 and Videocor1-02 oceanographic cruises were used in the framework of the European project IDEM www.idem-project.eu (Implementation of the MSFD to the Deep Mediterranean Sea). This project financed the production of a film for the general public accessible on Youtube (https://www.youtube.com/watch?v=LT_jgU0HGcY), as well as a traveling photo exhibition and a set of postcards.
The images were also used in an exhibition of the Parc national des Calanques "Plongée au c?ur des canyons" (https://www.expocanyons.fr/) which was initially planned for the IUCN World Congress in Marseille.
Video sequences were provided to the Brest aquarium, Océanopolis for an exhibition on cold water corals.


