Estuaries represent critical areas at the interface between the continent and the ocean. They are complex as they concentrate multiple interlaced pressures and issues, both environmental (quality and health of the ecosystem), economical (commercial fluxes, industrial areas) societal (urbanisation, recreational areas¿).
A challenge interconnecting all these issues is to quantify and apprehend the dynamics of sediment fluxes along the continuum. Indeed, these fluxes control at first order the morphodynamic evolution of the estuary, and hence the preservation of key habitats and the evolution of the navigation channels. Sediments are also a main vector for a variety of contaminants, and then control the water quality in the estuary. Finally, sediments in suspension directly control the euphotic depth and hence the primary production in the continuum, and the carbon transfer more globally.
Evaluating sediment fluxes require to observe the variability of suspended solid concentration and water fluxes along a section at multiple temporal scales. In this context, Rouen Port Authorities and the GIP Seine Aval deployed and manage the SYNAPSES observation network, measuring continuously among other parameters water turbidity that will be used to evaluate sediment fluxes for tides to decades.
This network is combined with the tidal gauge network, deployed at six sites along the estuary : Rouen, Heurteauville, Val des Leux, Tancarville, Fatouville and Balise A. Each station is equipped with a multiparameter probe (YSI6600V2) measuring pressure, conductivity, temperature, salinity, turbidity, fluorescence and dissolved oxygen. A complementary station was deployed at the mouth of the estuary by Ifremer (D4 Buoy).
Measuring SPM concentration at high frequency rely on indirect optical or acoustic sensors. These observations are strongly sensitive to SPM characteristics (nature, size, shape, density), and require a dense, repetitive, calibration phase. This sensitivity also generates potentially high uncertainties. The aim of the SYNAPSES field campaigns was to understand and better apprehend the interaction between the SPM (time-changing) characteristics and the optical/acoustic measurements, in order to evaluate uncertainties related to SPM concentration estimations.
SPM dynamics within the turbidity maximum zone
We were first interested in investigating the flocculation dynamics in the turbidity maximum zone. A dense and homogeneous dataset was collected at all stations along a neap/spring tidal cycle. Results are illustrated Figure 2, corresponding to the tidal survey conducted on January 26th at Fatouville station. SPM dynamics and flocculation processes in particular are strongly controlled by hydrodynamics : small aggregates are observed during flood and ebb periods, and flocculation occurs during slack periods, forming large flocs up to 300microns. However, some differences can be observed during these slack periods : flocculation is weaker during low water slack, that can be explained by the slow aggregation dynamics : low water slack duration is too short to reach a full optimal flocculation state. On the contrary, high water slack last longer, and larger flocs are observed. Moreover, a vertical dynamics is also observed at high slack : large aggregates created in the middle of the water column at late flood settle down, as shown by the decrease in the SPM concentration and the variability of the median floc size.
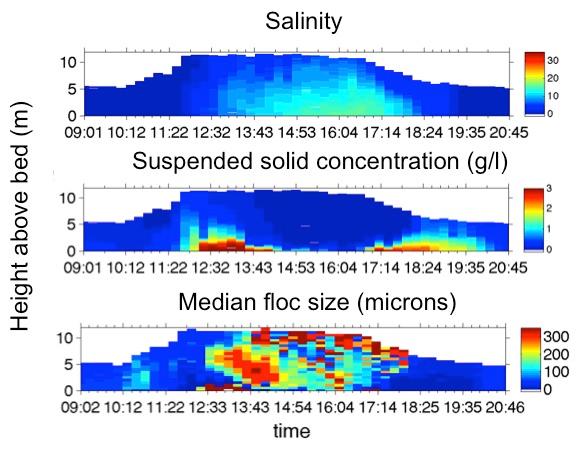
Figure 2 : SPM Dynamics at Fatouville station on Januray 26th, 2015.
We can also notice noisy LISST measurements when strong salinity gradient combined with low SPM concentration are observed,. This point will be further investigated in 2016, during the TURBISEINE field campaigns.
Calibration of the OBS sensors
Repetitive observations along a neap/spring tidal cycle for each station allow to investigate the variability of the OBS calibration coefficient. We can observed an hysteresis, similarly to the SPM structural dynamics (fractal dimension/floc density) observed during the FLUMES experiments in 2011. These observations clearly indicate that careful attention must be paid to the estimation of the SPM concentration when using indirect measurements, especially for long-term measurements. At least the variability in the response of the optical and acoustic sensor to SPM characteristics must be studied, on order to evaluate a relative uncertainty in the SPM quantification.
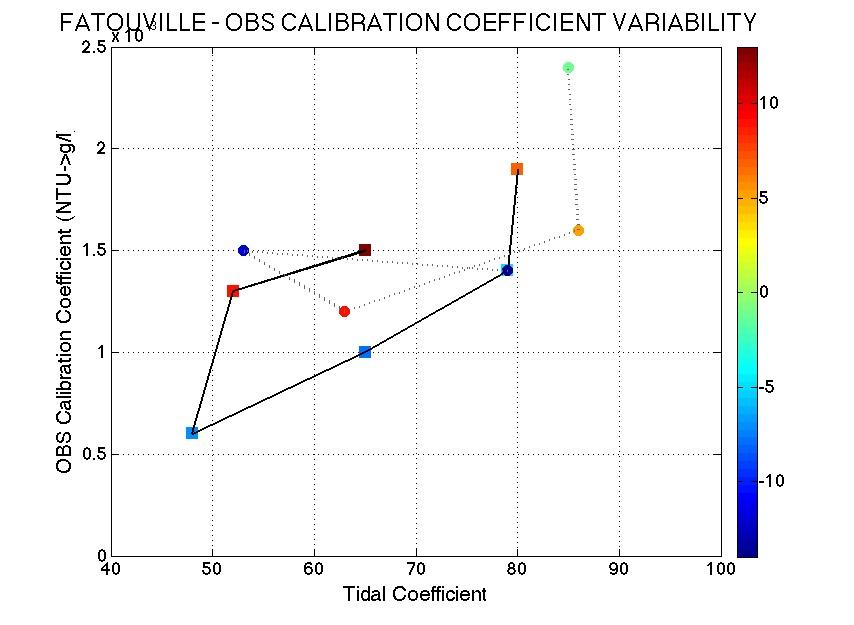
Figure 3 : Variability of the OBS3+ calibration coefficient (NTU->mg/l) along a neap/spring tidal cycle
Dynamics at the mouth : the D4 buoy
The SYNAPSES 2015 (and TURBISEINE2016) field campaigns were also dedicated to the calibration of the optical and acoustic sensors deployed at La Carosse (D4 buoy). We can note that the SPM concentration estimated from the ADCP compare well with the reference SPM concentration. However, when comparing with the long term optical measurements, data are more scattered, and then « less representative ». However, we must remind that these two measurements are all indirect evaluation of SPM concentration, with their own sensitivity to SPM characteristics. We must now investigate how much this variability is related to SPM features.
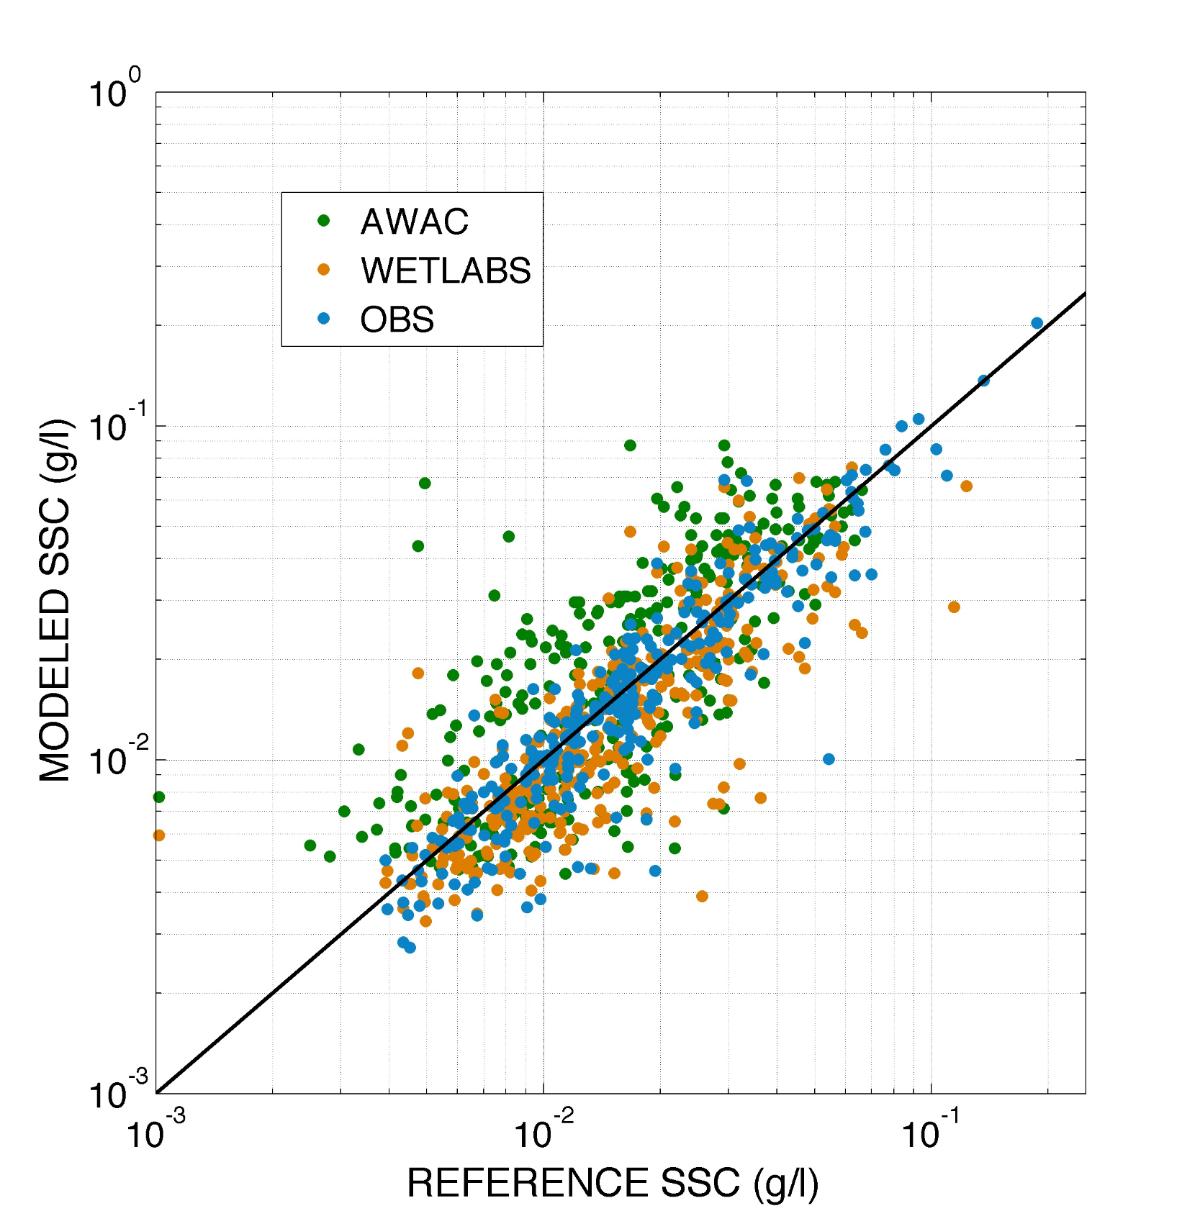
Figure 4 : Comparison between reference SPM concentration (samples) and SPM concentration from optical and acoustic sensors at La Carosse Station (D4).
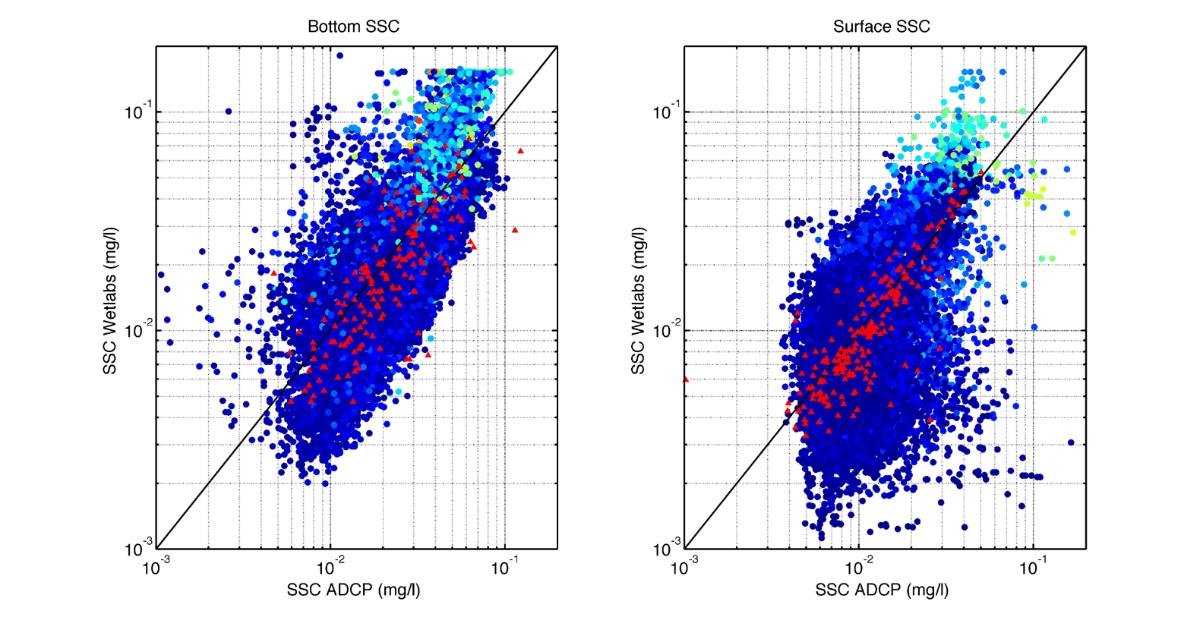
Figure 5 : Comparison of SPM concentration estimated from ADCP acoustic backscatter and optical turbidity sensor. In red : ADCP SPM concentration Vs reference SPM concentration from water samples
These observations of the SPM concentration over the entire water column give the opportunity to analyse the SPM temporal dynamics at the mouth of the estuary. We first observe a strong control of the tidal currents, as observed along the neap/spring tidal cycle on the sediment resuspension. Moreover, around late ebb, the influence of the estuarine water is clearly visible, featured by the presence of a surface turbid plume. Storms interfere with this periodic signal, generating high bed shear stress and strong sediment resuspension, up to twice more important than the tidal signal.
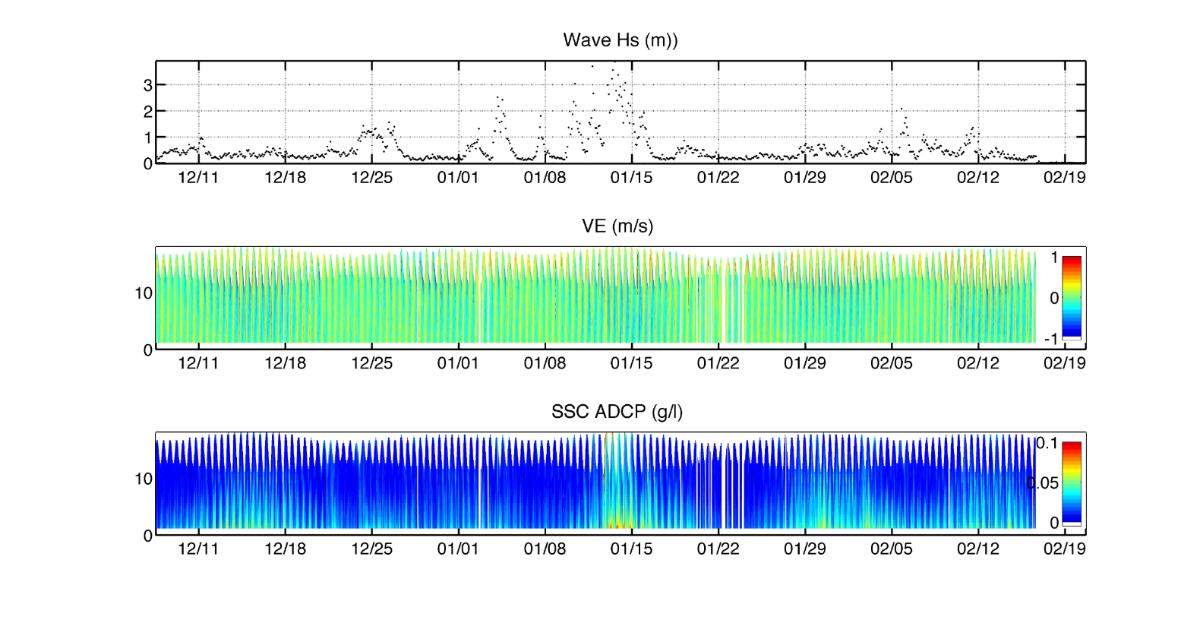
Figure 6 : SPM dynamics at La Carosse (D4) : Wave, current and SPM concentration
SYNAPSES estuarine stations
During the survey, stations in the estuary were located close to SYNAPSES stations, but at the opposite side of the channel for navigation security reasons. Comparing HF measurements and survey measurements revealed an issue with the surface sensor at the SYNAPSES stations. It also provides the opportunity to evaluate the variability of the turbidity signal along a cross section. However, these observations must be evaluated relatively, as sensors on-board the RV Côtes de la Manche and deployed from the SYNAPSES stations were different : OBS and YSI nephelometers, respectively.
The cross-section variability of the turbidity signal is illustrated in figure x : a vertical stratification is observed from the RV Côtes de la Manche data, contrary to the SYNAPSES data. However, the bottom turbidity dynamics is very close for the two points. These differences can be explained by the relative depth at the 2 stations : the SYNAPSES station is located close to the bank, with shallow water depth during flood, and strong mixing. On the contrary the Côtes de la Manche is anchored close to the navigation channel, in deeper waters : mixing is then not strong enough to homogenise the water column, as shown in figure 2.
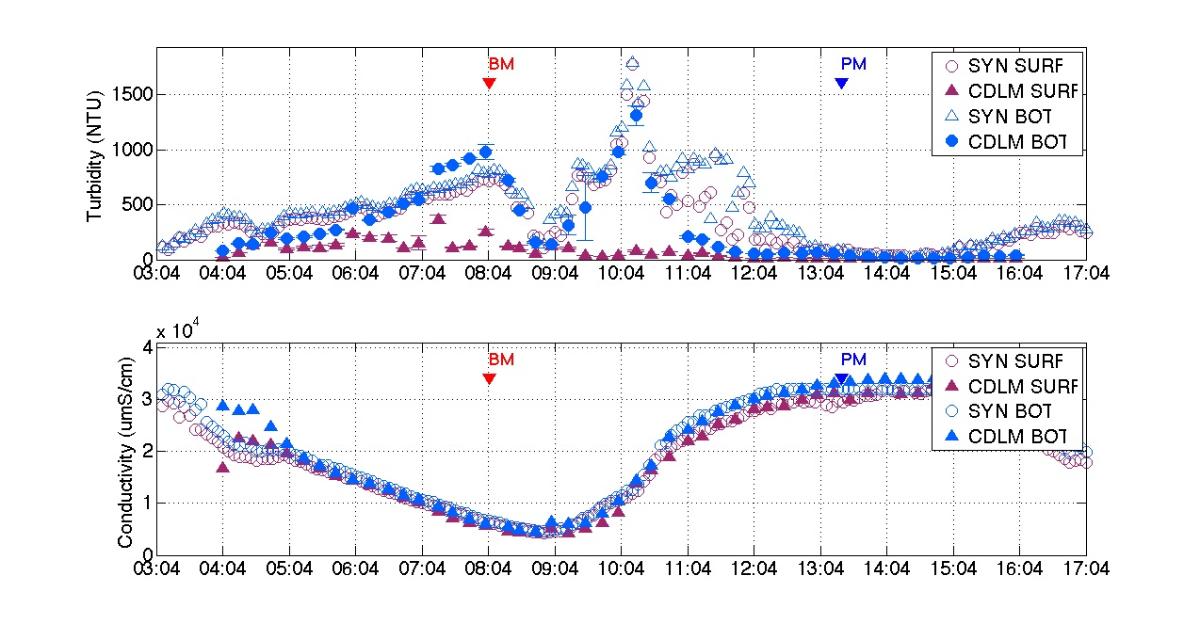
Figure 7 : Comparison of Salinity and Turbidity measurements at Fatouville station : SYNAPSES HF measurements Vs Côtes de la Manche measurements.
 , JACQUET Matthias


