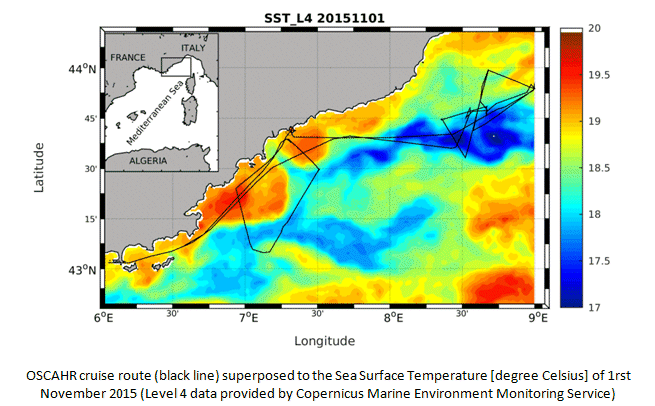
The scientific objectives of the cruise OSCAHR (Observing Submesoscale Coupling At High Resolution) were to characterize a fine-scale dynamical structure and to study its influence on the distribution of biogenic elements and the structure and dynamics of the first trophic levels associated with it. The methodology included the use of novel platforms of observation for sampling the ocean surface layer at a high spatial and temporal frequency. The cruise strategy utilized an adaptive approach based on both satellite and numerical modeling data to identify a dynamical feature of interest and to track its evolution. A new version of an automated flow cytometer (AFCM) optimized for small and dim cells was installed and tested for real-time, high-throughput sampling of phytoplankton functional groups, from micro-phytoplankton down to picocyanobacteria (including Prochlorococcus).
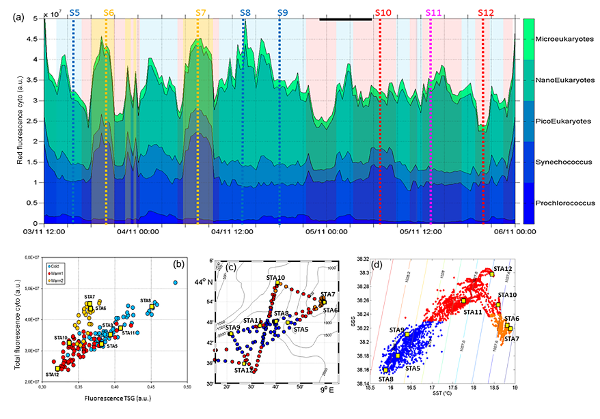
Marrec et al. [2018, figure 1] demonstrated that subsurface cold waters reached the surface in the center of a cyclonic recirculation into the Ligurian sub-basin. These nutrient-rich upwelled waters induced an increase in Chl a concentration, and associated primary production, in the center of the structure, whereas surrounding warm and oligotrophic boundary waters remained less productive. The phytoplankton community structure was dominated in terms of abundance by Prochlorococcus, Synechococcus, and pico- and nano-eukaryotes, respectively. The study of the fine-scale vertical distribution of Prochlorococcus and Synechococcus showed that the dominance of Prochlorococcus vs. Synechococcus in cold core waters was closely linked to the upwelled subsurface waters. Coupling a cell's optical properties and physical properties appears to be a valuable approach for characterizing the origin of distinct surface water types.
The OSCAHR campaign perfectly encompasses the new opportunity offered by coupling fine-scale vertical and horizontal physical measurements, remote sensing, modeled data, in situ AFCM and biogeochemistry using an innovative adaptive sampling strategy, in order to deeply understand the fine-scale dynamics of the phytoplankton community structure. The unprecedented spatial and temporal resolution obtained thanks to the latest advances in AFCM deployment allowed us to clearly demonstrate the preponderant role of physical fine-scale processes in the phytoplankton community structure distribution. For the first time, using this new model of Cytobuoy commercial AFCM, we were able to fully resolve Prochlorococcus and Synechococcus picocyanobacteria, the smallest photoautotrophs on Earth, which play a major role in widespread ocean oligotrophic areas. Single-cell analysis of well-defined Prochlorococcus and Synechococcus functional groups associated with a size structure population matrix model provided some valuable indications of the daily dynamics of these populations. Primary productivity estimates of these two major phytoplankton species obtained by this model are essential for better understanding the contribution of picocyanobacteria to biological productivity. The study by Marrec et al. [2018] encourages the continuation and improvement of such a strategy to biogeochemically quantify the contribution of such fine-scale structures in the global ocean.

Figure 1 [from Marrec et al., 2018]
(a) Relative contribution FLR i = (FLR m,i · Abundance i ) of Prochlorococcus, Synechococcus, picoeukaryotes (PicoE + PicoHighFLR + PicoHighFLO), nanoeukaryotes (NanoE + NanoFLO + NanoHighFLO) and microeukaryotes (MicroE + MicroHighFLO) to the integrated red fluorescence signal (FLR Total = i (FLR m,i · Abundance i )) from 3 November 12:00 to 6 November 00:00. Vertical dashed lines represent sampling times of the eight fixed stations (STA5 to STA12) performed during the campaign and colors correspond to the type of surface waters in which stations were performed. (b) Fluorescence recorded with the FLRTotal (in a.u.) vs. TSG (in a.u.) recorded by the automated flow cytometer. Blue, red and orange dots correspond to sampling performed in cold core, warm boundary 1 and boundary 2 surface waters. (c) Sampling positions of automated flow cytometry surface measurements. Blue, red and orange dots correspond to sampling performed in cold core, warm boundary 1 and boundary 2 surface waters. (d) SSS vs. SST (in oC) plot from continuous TSG measurements with corresponding density isolines. The distinction between cold core and warm boundary 1 and 2 surface waters throughout the paper was made according to this plot.
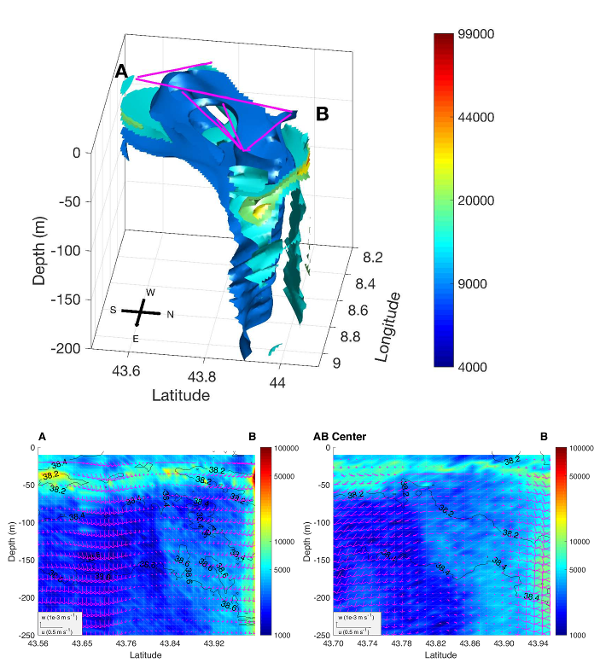
Rousselet et al. [2019, figure 2] analyzed in more detail the 3-D organization of the studied cyclonic structure. Reconstructed 3-D fields of density and horizontal velocities are used to estimate the vertical velocity field down to 250 m by applying the adiabatic QG omega equation, for the first time in this region. The vertical motions are characterized by multi-polar patterns of downward and upward velocities on the edges of the structure and significantly smaller vertical velocities in its center. Both the 3-D distribution of particles measured with a Laser Optical Plankton Counter (LOPC), and the Synechococcus and Prochlorococcus abundances measured by flow cytometry are consistent with the 3-D velocity field. In particular, a secondary vertical recirculation is identified that upwells particles (from 250 to 100 m) along isohalines to the structure's center. Besides demonstrating the effect of vertical patterns on biogeochemical distributions, this case study suggests to use particle matter as a tracer to assess physical dynamics.

Figure 2 [from Rousselet et al., 2019]
Top. 3-D (longitude, latitude, depth) isosurfaces of particle abundances (colorbar, particles m-3) reconstructed with the objective mapping method. The MVP sections used for the reconstruction are drawn at the surface with the magenta lines. Bottom. Vertical section of particle abundances (colorbar, particles m-3) superimposed with along-track and vertical velocity components (black arrows, m s¿1 ) along the AB transect (4 November, LEFT) and along the transect between AB center and B (5 November , RIGTH). Isocontours of salinity are represented with black lines (intervals of 0.2).
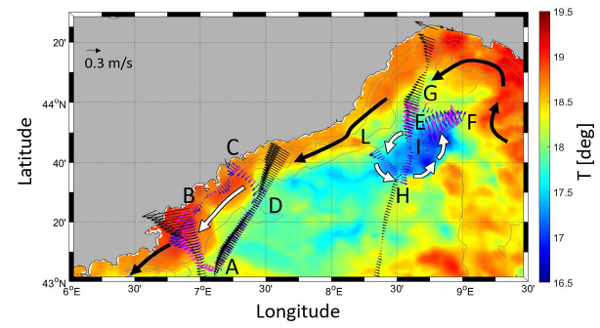
Meloni et al. [2019, figure 3] provided a first contribution to the European Space Agency's efforts aimed at establishing reference in situ networks specifically targeted to validate coastal altimetry. For this purpose, in situ measurements acquired during OSCAHR were processed and cross-compared conjointly with improved altimetry data over the Ligurian Sea. Several kinds of multi-sensor in situ observations located along SARAL and Jason-2 tracks were used. The main objectives of the study were to assess improved coastal oriented validation strategies, including the usage of a new in situ platform such as the Moving Vessel Profiler, while better understanding potential differences owing to physical content inconsistency and instrumental or data processing limitations. The results show remarkable agreements over spatial scales of few tens of kilometres, paving the way for the deployment of future in situ networks and the definition of science-oriented diagnostics targeted to assess the capability of present and future high-resolution altimetric missions in resolving small-scale physical features.

Figure 3 [from Meloni et al., 2019]
Surface circulation pattern derived from in situ (magenta for MVP and blue for ADCP) and PEACHI altimetry data (black). SST data is also shown with a Spatial Resolution of 0.062° (Latitude) × 0.062° (Longitude) and temporal resolution of 1 day. The SST maps is an average over the OSCAHR cruise time period. White arrows depict a scheme of the the surface oceanographic feature.
-------------------------------------------------------------------


