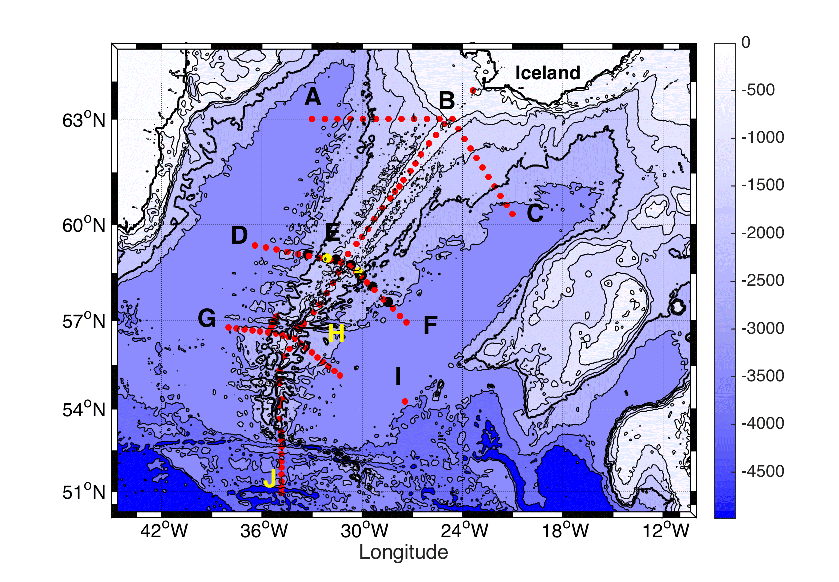
The Reykjanes Ridge is a major topographic feature located south of Iceland in the North-Atlantic Ocean that strongly influences the subpolar gyre (SPG) circulation. The temporal mean and variability of the structure of the flow along and over the ridge and the prevailing dynamical regimes are still poorly characterized and understood. In addition, numerical models used both for climate scenarios and operational short-term forecasts present deficiencies in the subpolar gyre, which are partly due to a wrong representation of flow-topography interactions around the Reykjanes Ridge. In the RREX project, we proposed an in-depth investigation of the interactions of the ocean currents with the Reykjanes Ridge in order to: document the circulation around and over the ridge and identify the processes controlling the dynamical connections between the two sides of the ridge; quantify and understand the water mass transformation near the Reykjanes Ridge; identify key parameters in general circulation models that are critical for an adequate representation of the circulation and water mass transformation at the Reykjanes Ridge.
The RREX project, together with the OVIDE project, are the french contribution to the OSNAP program (Lozier et al, 2017, 2019).
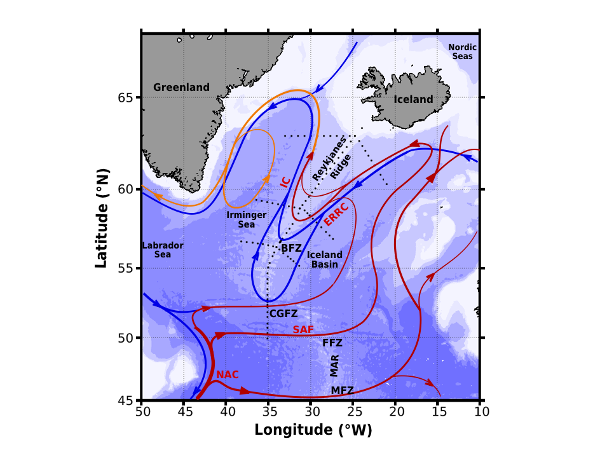
Figure 1: Schematic of the large-scale circulation in the northern North-Atlantic. Locations of the hydrographic stations carried out during the RREX2015 cruise (black dots). Topographical features of North-Atlantic are labeled: Bight Fracture Zone (BFZ), Charlie-Gibbs Fracture Zone (CGFZ), Faraday Fracture Zone (FFZ), Maxwell Fracture Zone (MFZ), Mid-Atlantic Ridge (MAR)). The main associated currents are indicated: NAC, SAF, ERRC and IC.
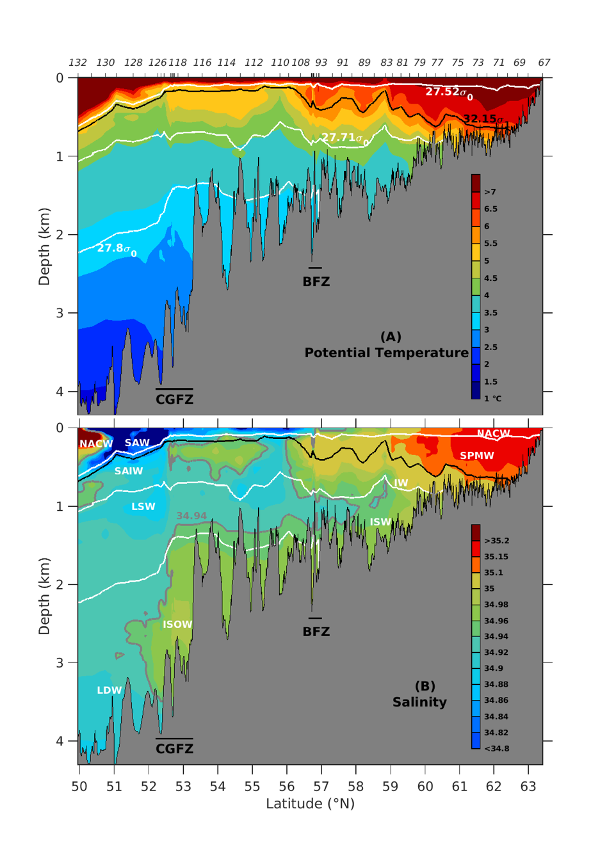
Figure 2: Hydrographic sections along the Reykjanes Ridge section based on CTDO2 data: (A) Potential temperature in °C; (B) Salinity. The bold black lines represent the potential density anomaly sigma1 = 32.15 kg m-3. The bold grey lines show the isohaline 34.94 in panel (B). The bold white lines show the potential density anomalies sigma0=27.52, 27.71 and 27.8 kg m-3 . Bathymetry in grey is from the ship survey. The Bight and Charlie Gibbs fracture zones are indicated.
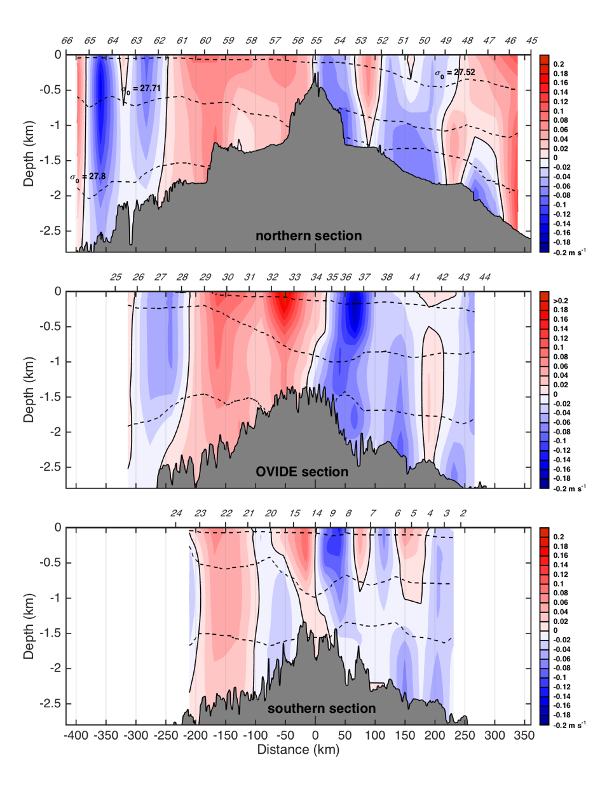
Figure 3: Geostrophic velocity along the northern (upper panel), OVIDE (middle panel) and southern (lower panel) sections (m s-1). Positive values correspond to northward velocities. The black bold line outlines the 0 isotach. The dashed black lines indicate the potential density sigma0 = 27.52, 27.71 and 27.8 kg m-3. Bathymetry from the ship survey is added in grey. Locations of the hydrographic stations are indicated on the top axis.
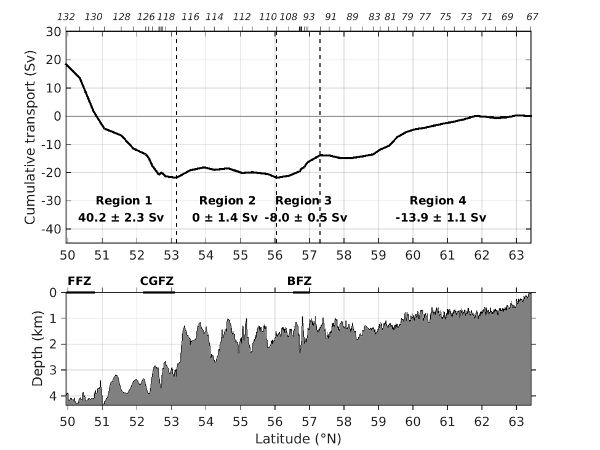
Figure 4: Upper panel: Top-to-bottom vertically integrated transport (Sv) along the Reykjanes Ridge section cumulated from Iceland to 50°N. Increasing (decreasing) cumulative transport corresponds to eastward (westward) transport. The locations of the hydrographic stations are shown on the top axis. Lower panel: Bathymetry along the Reykjanes Ridge section.
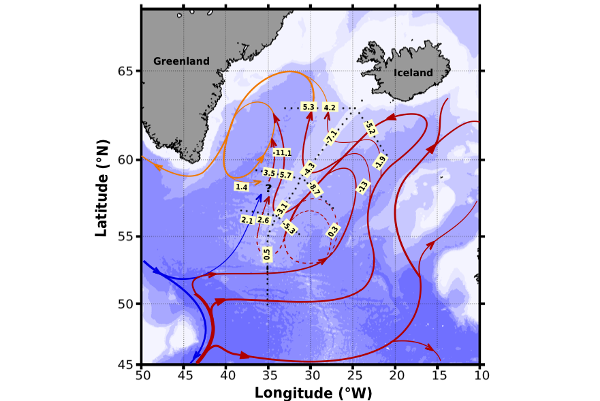
Figure 5: Schematic of the large-scale circulation of the upper layer in the northern North-Atlantic deduced from the RREX15 dataset. Dashed arrows indicate the uncertain pathways. Transports (Sv) of the layer across the sections are indicated on the yellow boxes. Positive transports are associated with northward or eastward flows across the sections. Bathymetry is plotted in color with color changes at 500 m, 1,000 m and every 1,000 m below 1,000 m.
Based on velocity and hydrographic measurements carried out along and perpendicular to the crest of the Reykjanes Ridge from the Icelandic continental shelf to 50°N during the RREX cruise in June-July 2015 (IFigures 1 and 2), we derived the first direct estimates of volume and water mass transports over and along the Reykjanes Ridge (Petit et al, 2018, Petit et al, to be submitted). We estimated the subpolar gyre (SPG) intensity at 21.9 ± 2.5 Sv in summer 2015 (Figure 3). We showed that the westward limb of the SPG was intensified at the Bight Fracture Zone (57°N) and at 59-62°N and that horizontal circulation, mixing, and bathymetry shaped the water mass distribution over the Reykjanes Ridge. We also investigated the evolution of the flow along the ridge: the East Reykjanes Ridge Current (ERRC) and of the Irminger Current (IC) flowing southwestward in the Iceland Basin and northeastward in the Irminger Sea, respectively. The hydrological properties, structures and transports of the ERRC and IC consistently evolve as they flow along the Reykjanes Ridge (Figure 4). We show that these latitudinal evolutions are due to flows connecting the ERRC and IC at specific locations through the complex bathymetry of the ridge, but also to significant connections between these currents and the interiors of the basins (Figure 5).
Using five deep-Argo floats (0-4000m) deployed in 2015 and 2017 in the Charlie Gibbs Fracture Zone (CGFZ), the main fracture zone of the Reykjanes Ridge, during RREX cruises, we investigated circulation and mixing of Iceland-Scotland Overflow Water (ISOW), a dense water mass of the North-Atlantic Ocean (Racapé et al., submitted). The floats drifted in the ISOW layer and followed different routes depending on northward intrusions of the North Atlantic Current (NAC) with deep-reaching velocities over the northern valley of the CGFZ. One float revealed a direct route for ISOW from CGFZ to the Deep Western Boundary Current (Figure 7). Owing to the oxygen measurements from Deep-Argo floats (Figure 6), we showed that the ISOW layer in the CGFZ was composed of the highly oxygenated ISOW and the less oxygenated North East Atlantic Deep Water (NEADW), a complex water mass from East-Atlantic and that the interaction between the NAC and the deep vein favors mixing between ISOW and NEADW.
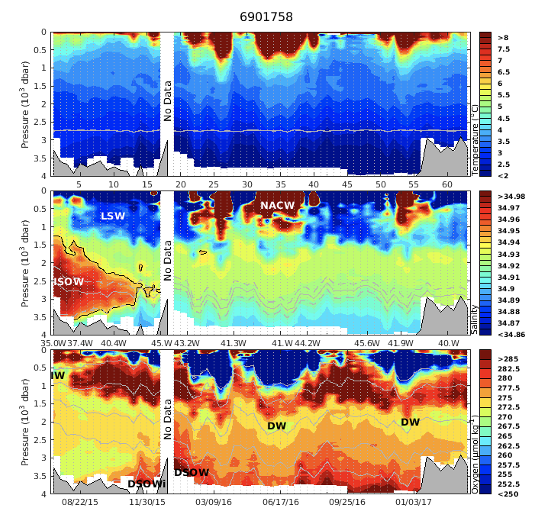
Figure 6: Section of potential temperature (top; in °C), salinity (middle) and dissolved oxygen concentration (bottom; in µmol kg-1) measured along trajectory of float 6901758.
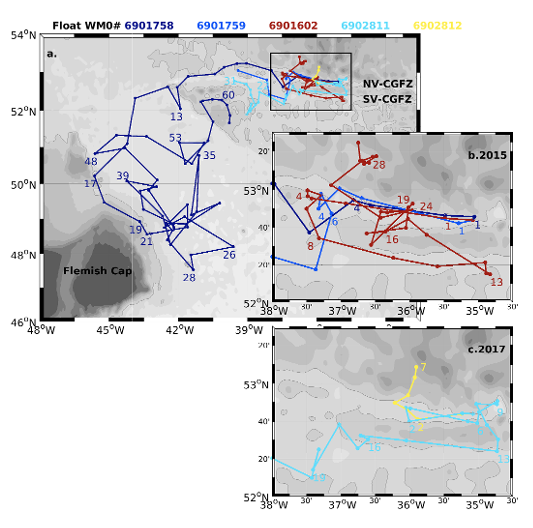
Figure 7: (a) Trajectories of the five Deep-Argo floats launched at the Charlie-Gibbs Fracture Zone (CGFZ) in summers 2015 and 2017. (b,c) Zoom over the northern and the southern valley of CGFZ for 2015 (b) and 2017 (c). The colored lines correspond to the float trajectories: WM0#6901758 in dark blue; #6901759 in blue; #6901602 in red; #6902811 in cyan; #6902812 in yellow. The grey line shows isobaths 3500m.
To investigate the effect of topography and resolution on the subpolar gyre dynamics in numerical models, we ran new simulations of the subpolar gyre at high-resolution (dx=6 km and 2 km) with a terrain-following coordinate model (ROMS/CROCO) The 2-km simulation allows us to resolve mesoscale eddies in most of the gyre. The simulations revealed an improved representation of the mean currents and their variability at the surface and in the interior compared to previous simulations with coarser resolution. Based on a barotropic vorticity budget (Le Corre et al., to be submitted), we showed that the Reykjanes Ridge is an important part of the gyre vorticity balance. The flow around the ridge corresponds to a balance between the bottom pressure torque and non-linear terms, which help the flow crossing potential vorticity contours (f/h). An idealized simulation representing a flow around a ridge showed an increase cross-ridge transport with the non-linear term. The export of barotropic vorticity toward the inside of the gyre is localized on the western side, where the eddy activity is stronger.
Numerical simulations using a two-layer shallow-water model were performed using a highly idealized ridge geometry. The drag in geophysical flows over topography is commonly modeled by a quadratic law. For a rotating fluid, we showed that in the two-layer shallow-water approach, the pressure drag of a sub-critical flow around an inclined ridge is in good approximation independent of the flow speed (Wirth and Flor, 2018, https://hal.archives-ouvertes.fr/hal-01709679). Numerical simulations results confirm this for a large range of Rossby numbers for both, barotropic and baroclinic flows approaching the ridge. The behavior is explained by the observation that for larger speeds the flow crosses the ridge at lower depth leading to a shorter path-length. As the frictional head loss is a product of the velocity and the path length, both compensate.
We also performed laboratory experiments on a medium size rotating table (1m of diameter). Three master (M2R) students worked on the design and improvement of a laboratory experiment to reproduce and investigate an oceanic flow pattern around a topographic ridge. The turntable broke down during the experiments and has not been repaired so far due to lack of funding.
The scientific analyses will continue in the coming years. We will use data acquired as part of the RREX2017 cruise, data provided by the RREX moorings and Argo floats to investigate the seasonal to interannual variability of the flow near the ridge and their horizontal and vertical structures and to identify the mechanisms involved in the observed variability (Figure 4). This work is currently done as part of the Phd thesis of Ivane Salaun (2018-2021). A paper on the flow through the Bight Fracture Zone will be written in 2019. It is based on hydrographic data acuqired in the Bight Fracture zone during the RREX2015, OVIDE2016 and RREX2017 cruises and by Deep-Argo floats. We will also quantify the geography and time variability of energy dissipation and mixing over the Reykjanes Ridge, untangle the processes at work in dissipating energy and assess numerical models' capability to reproduce/parameterize the small-scale dissipation processes. Those analyses will be performed as part of the post-doc of Clement Vic (2019-2020). We will also combine data from the deep Argo floats deployed during the RREX cruises with the RREX and Ovide datasets to quantify and understand seasonal to interannual variability of Irminger Sea abyssal waters (ISOW and North-Atlantic Deep Water) (post-doc funded by Ifremer; start in november 2019). The moorings data will also be included in the next release of the OSNAP time series (Lozier et al, 2019). A synthesis analysis will be conducted based on the data and model analyses.
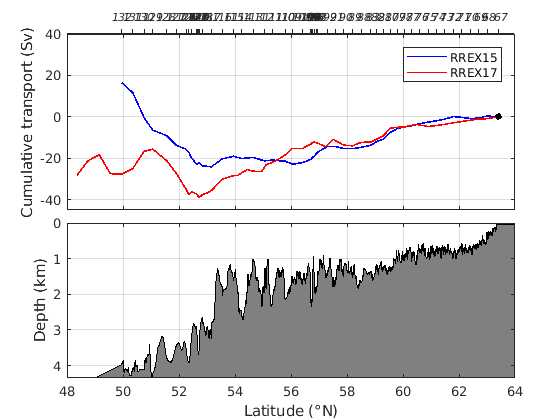
Figure 8: Top-to-bottom vertically integrated transport (Sv) along the Reykjanes Ridge section cumulated from Iceland to 50°N. Increasing (decreasing) cumulative transport corresponds to eastward (westward) transport. (Blue line) Transport estimated from RREX2015 dataset. (Red line) Transport estimated from RREX2017 dataset.


